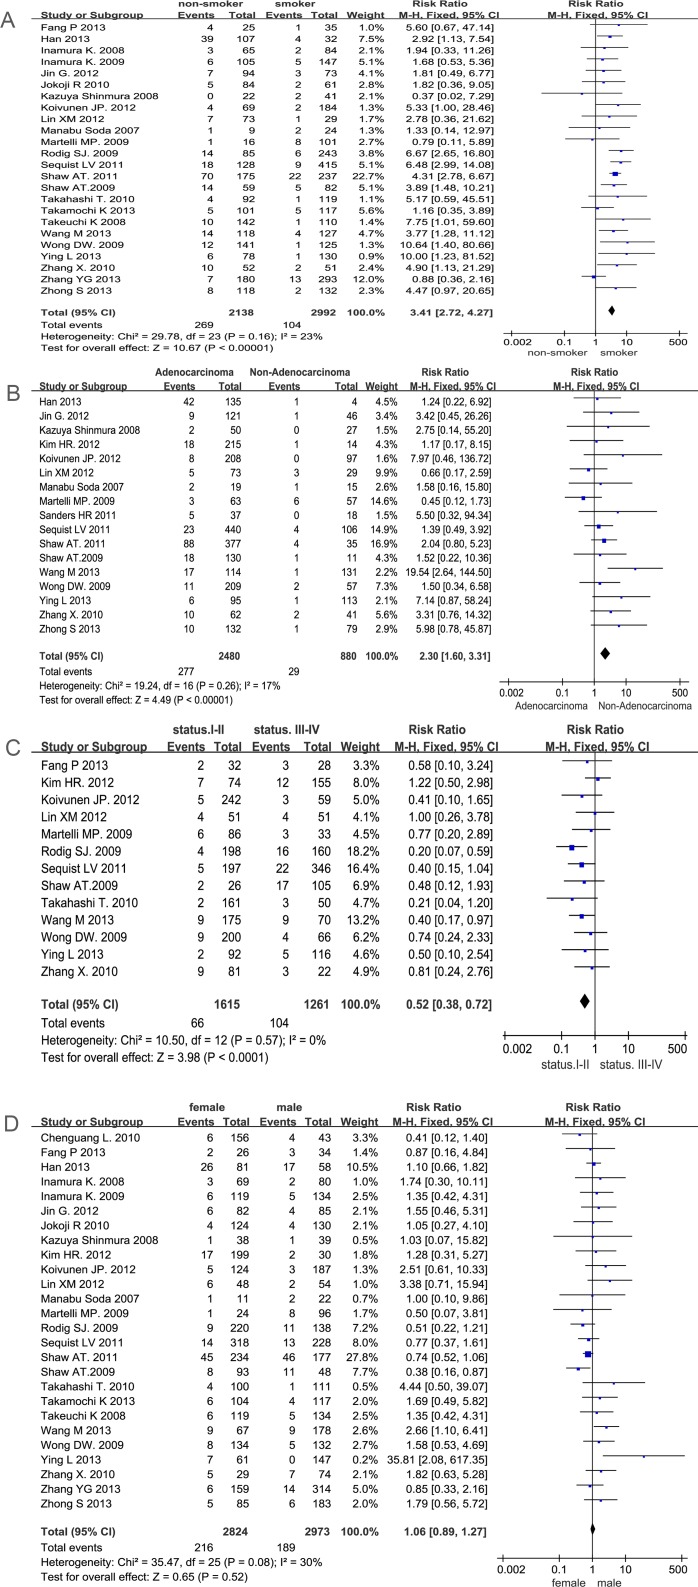
Fig 2. Meta-analysis of data for EML4-ALK.
(A smokers vs no-smokers; B adenocarcinomas vs non-adenocarcinomas; C stages I-II vs stages III-IV; D male vs female). Forest plot of the Relative Risk (RR) of the clinicopathological characteristics with EML4-ALK fusion gene patients. The RR estimate of each individual trial corresponds to the middle of the squares and the horizontal line gives the 95% CI. On each line, the numbers of events are represented as fractions of the total number; random choices are shown for both treatment groups. For each subgroup, the sum of the statistics, along with the summary RR are represented by the middle of the solid diamonds. A test of heterogeneity between the trials within a subgroup is given below in summary of the statistics.

