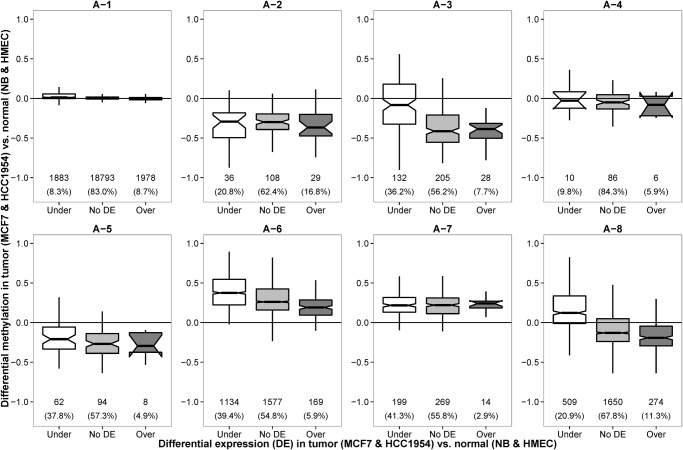
Fig 3. Distribution of differential methylation levels of gene promoters for under-expressed, over-expressed and not differentially expressed genes between breast cancer cell lines (MCF7 and HCC1954) and normal breast samples (NB and HMEC).
The differential methylation and differential gene expression between breast cancer cell lines and normal samples were negative correlated in A-3, A-6 and A-8 promoter HMRs. In other HMR clusters, the distributions of differential methylation levels among under-expressed (Under), over-expressed (Over) and not differentially expressed (No DE) genes were similar in form.

