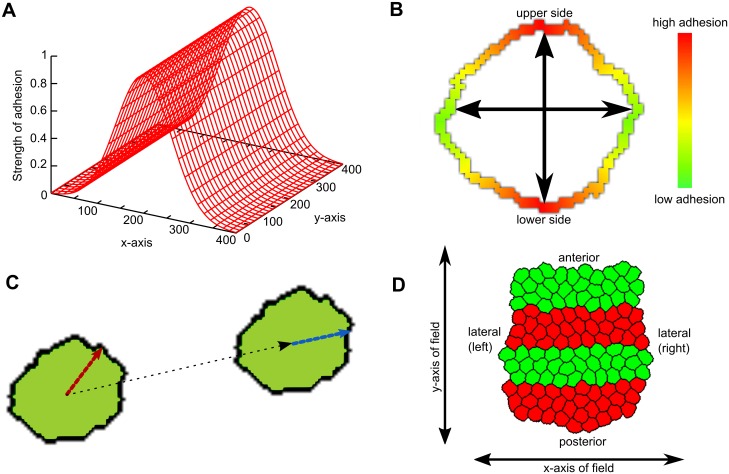
Fig 1. Model setup.
(A) Graded adhesion. In the center of the field, adhesion between cells is higher than at the boundaries. This difference is smoothly graded according to a Gaussian distribution. (B) Axial adhesion. The parts of the membrane that are coloured red (and indicated by the vertical axis) adhere more to neighbours than the sides, which are coloured green (and indicated by the horizontal axis). The strength of adhesion is graded smoothly across the membrane, and the orientation of the axes is fixed and identical for all cells. (C) Persistence mechanism. The cell has a higher propensity to move approximately in its target direction (red vector) than the opposite direction. Every s Monte Carlo Steps (MCS), this vector is updated according to the actual displacement of the cell (black vector; new vector: blue). (D) Initial state of the tissue. Cells are placed closely together, so that they form a coherent tissue at the start of the simulation. The tissue is already subdivided into regular segments of identical widths and cell numbers.

