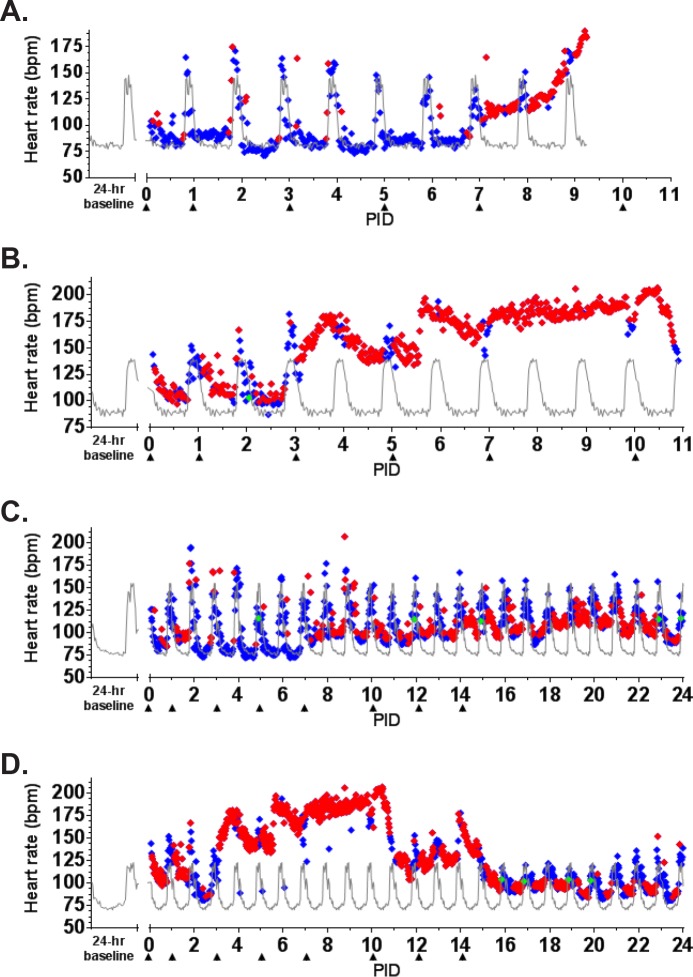
Fig 4. Heart rate as measured by telemetry.
ITS telemetry devices were used to collect heart rate data. (A) NHP 1; (B) NHP 2; (C) NHP 3; (D) NHP 4. The grey line represents baseline (mean of the telemetry data collected in the six days prior to challenge) for each animal. The diamonds represent statistically significant heart rate values (> +3 SD [♦] above or > -3 SD [♦] below baseline) or non-significant values (♦). bpm = beats per minute.

