
Figure 5.
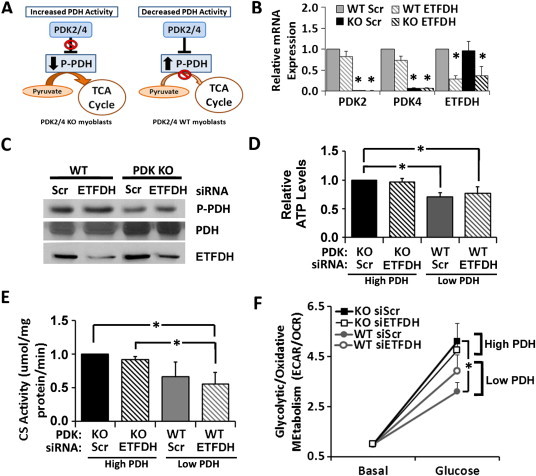
Double knockdowns in myoblasts recapitulate the IR phenotypes predicted by in silico experiments. (A) Schematic of PDK2/4 regulation of PDH. (B) mRNA expression by qRT-PCR analysis. (C) Western blot analysis of phosphorylated and total PDH and ETFDH protein expression. (D) Changes in ATP levels (normalized to protein). (E) Changes in citrate synthase (CS) activity (normalized to protein). (F) Changes in ECAR/OCR values (normalized to DNA) under basal conditions (250 μM palmitate) and after addition of 5.5 mM glucose, shown relative to the basal level. *p < 0.05.