
Figure 2.
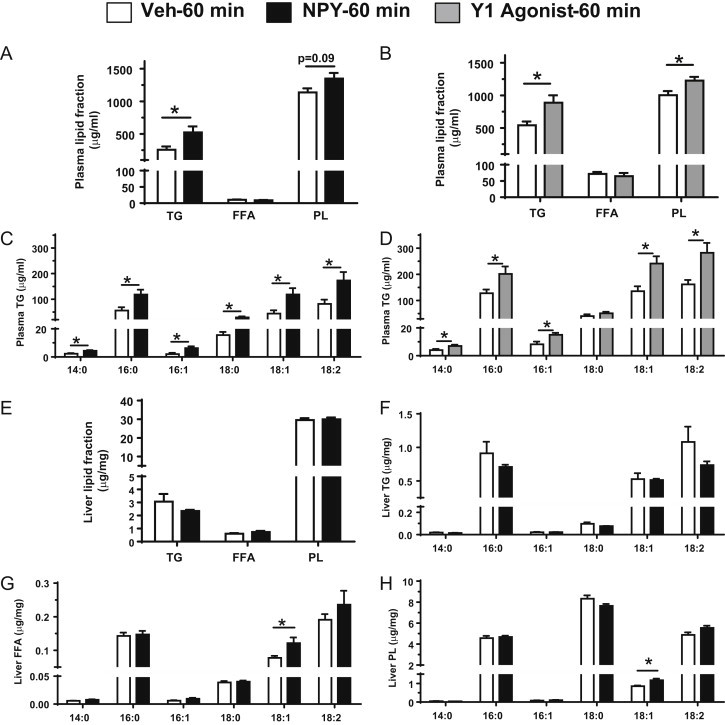
Changes in plasma and liver lipid content in response to CNS NPY and Y1 receptor agonist signaling. Plasma and liver samples from lean 4-h fasted rats (n = 5–6/group) were collected 60 min post-icv injection of either NPY (1 nmol; black bars) or the Y1 receptor agonist [F7, P34]-NPY (1 nmol; gray bars) or Veh (white bars) and were used to measure the following: plasma TG, FFA, and PL content in icv NPY- (A) or Y1 receptor agonist- (B) or Veh-treated rats. FFA composition of plasma TG was analyzed for changes in individual FFA levels of myristic acid (14:0), palmitic acid (16:0), palmitoleic acid (16:1), stearic acid (18:0), oleic acid (18:1), and linoleic acid (18:2) after icv treatment with NPY (C) or the Y1 receptor agonist (D). Levels of total TG, FFA, and PL fractions in liver (E) were measured from icv NPY- or Veh-treated rats. FFA composition of liver TG (F), FFA (G), or PL (H) were analyzed for changes in individual FFA levels of 14:0, 16:0, 16:1, 18:0, 18:1, and 18:2 after icv treatment with NPY. Data are presented as mean ± SEM and were analyzed by Student's t-test (unpaired, two-tailed); *indicates a significant difference (p < 0.05) between icv treatment vs. Veh.