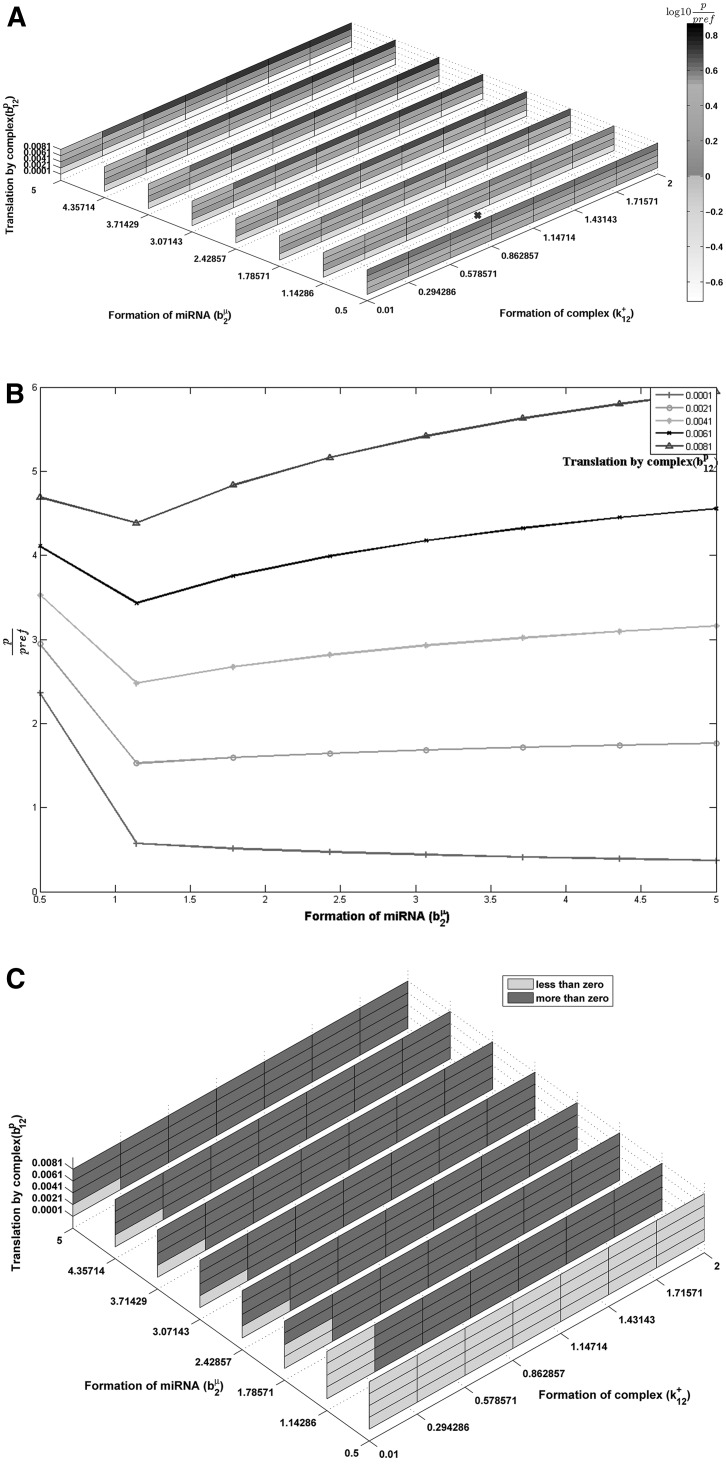
FIGURE 4.
(A) Scaled protein steady-state level for two miRNAs competitively interacting with single mRNA as a function of rate of formation of miRNA2 (b2μ), translation by complex c12 (b12p), and formation of complex c12 (k12+). All three axes ranges are exactly as in Figure 3A. Position marked with × corresponds to reference values of b1μ, b11p, and k11+ as listed in Table 2. Other parameter values constant, given in Table 2. (B) Line plot of scaled protein level for two miRNA, competitively interacting with single mRNA. Lines represent specific parts of A, for constant complex formation rate (k11+=0.2943/molecule/sec). For some constant levels of b12p increase in rate of miRNA formation (b2μ) leads to increase in protein ratio levels. Reference values of b1μ, b11p, and k11+ listed in Table 2 are 1 molecule/sec, 0.001/sec, and 1/molecule/sec. Other parameter values constant, given in Table 2. (C) Binarized protein steady-state sensitivity to miRNA formation rate for two miRNAs competitively interacting with single mRNA as a function of rate of formation of miRNA2 (b2μ), translation by complex c12 (b12p), and formation of complex c12 (k12+). All three axes ranges are exactly as in Figure 3B. The two colors depict the light gray regions of expected (negative sensitivity, protein decreases with miRNA formation rate) and dark gray regions of unexpected (positive sensitivity) effects of miRNA on steady-state target protein level, in contrast with Supplemental Figure S2 for a 1miRNA–1mRNA system with the same parameters which is uniformly green (expected effect). Other parameter values are constant, given in Table 2.

