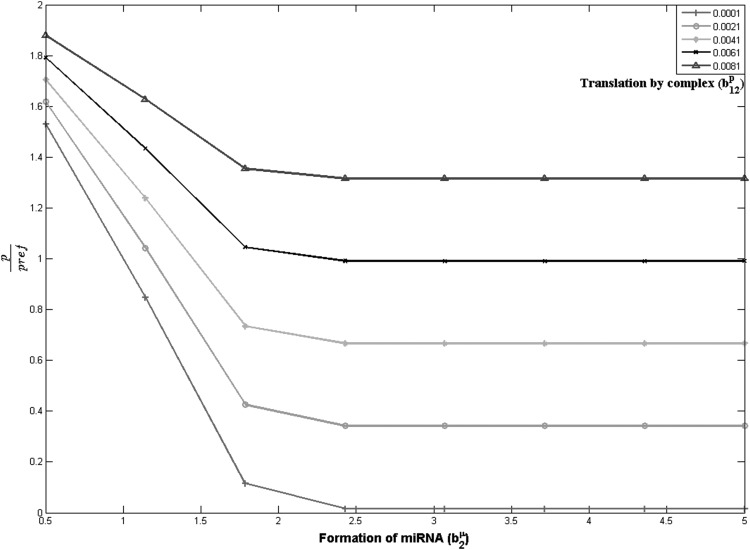
FIGURE 5.
Line plot of scaled protein level for two miRNA, noncompetitively interacting with single mRNA. Lines represent specific parts of Supplemental Figure S3. For every constant level of b12p increase in rate of miRNA formation b2μ leads to decrease in protein ratio levels. Other parameter values are constant, given in Table 2.

