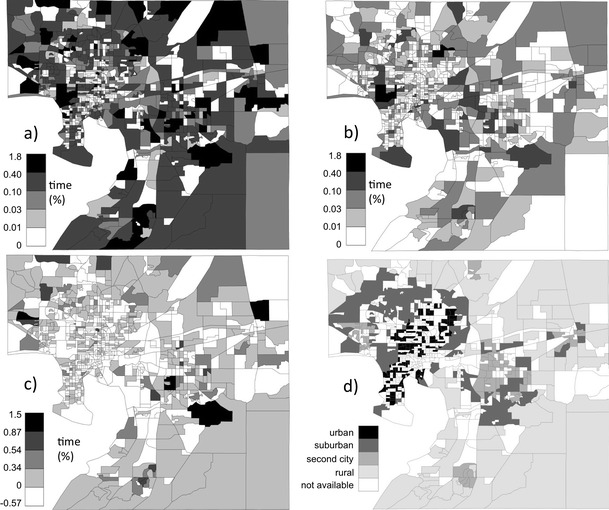
Fig. 2.

The spatial distribution of sample population activity time (% of time spent) and urbanicity in the study area. a % of total time spent in all activity types within the block group, b % of total time spent in nonresidential activities within the block group, c difference (%) between residential and nonresidential activity times spent in each block group, and d urbanicity category of the block group
