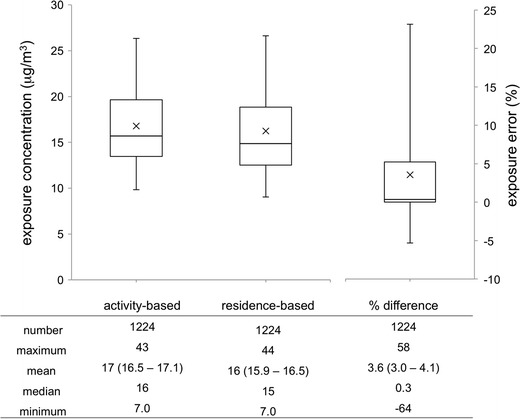
Fig. 4.

Cumulative distributions for the activity-based daily exposure concentration (left side), residence-based daily exposure concentration (middle), and daily exposure error between the two as a percent difference, (C A−C R) / C A (right side). The box plot whiskers indicate the 5th and 95th percentile values, while cross indicates the mean value. Summary statistics are provided below each box plot; 95 % confidence intervals around each mean are in parentheses
