
FIGURE 2.
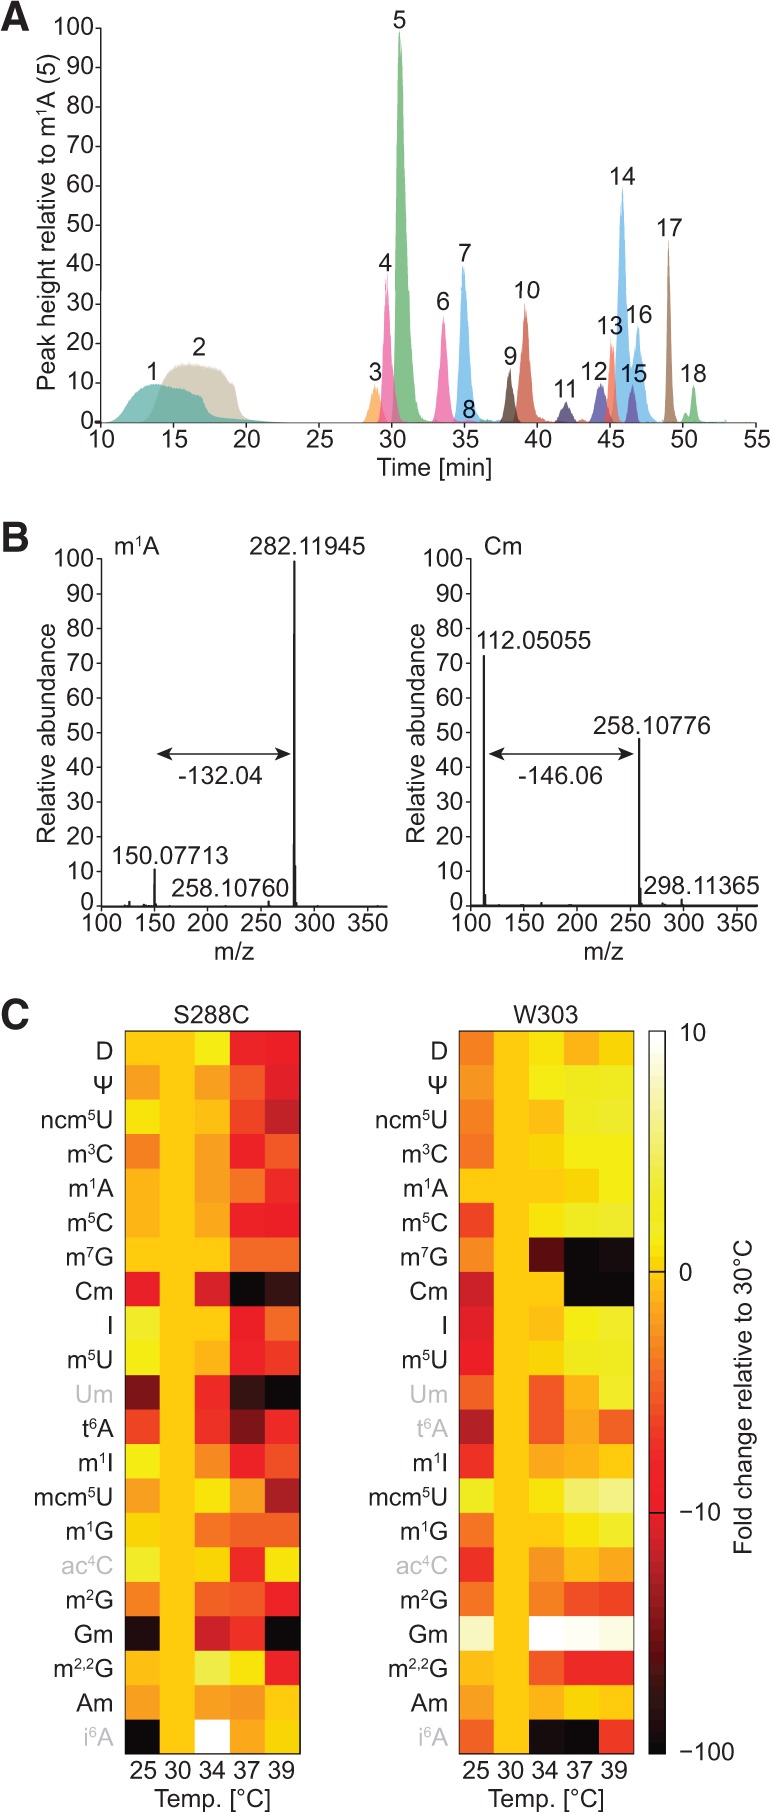
Quantitative liquid chromatography mass spectrometry analysis reveals differences in tRNA modification levels following temperature stress. (A) Superimposed extracted-ion chromatograms (XICs) of the 18 most prominent nucleoside modifications found in yeast. The average retention time (n = 3) for each modification in this chromatographic setup is indicated in minutes: 1, D (13.8); 2, Ψ (17.37); 3, ncm5U (29.03); 4, m3C (30.05); 5, m1A (31.78); 6, m5C (34.57); 7, m7G (36.24); 8, Cm (36.75); 9, I (38.28); 10, m5U (39.32); 11, t6A (43.44); 12, m1I (44.82); 13, mcm5U (45.37); 14, m1G (45.75); 15, ac4C (46.53); 16, m2G (46.63); 17, m2,2G (48.83); 18, Am (51.65). In addition, we detect yW (26.68), mcm5s2U (39.43), Um (42.06), ct6A (44.44), Gm (46.93), ncm5Um (47.92), and i6A (55.50). The canonical bases are omitted for clarity. (B) Full mass spectrum depicting the neutral loss occurring upon ionization-induced fragmentation of a nucleoside with a native (m1A) or methylated (Cm) ribosyl group, respectively. (C) Heat map depicting the relative comparison of normalized modification levels at various temperatures for 21 nucleosides detected by pyQms in samples from S. cerevisiae S288C and W303. The scale bar indicates the fold change in modification levels compared with 30°C (10-fold increase shown as white, no change as pale orange, and 100-fold decrease as black). Modifications that yield a weak MS signal are labeled in gray.