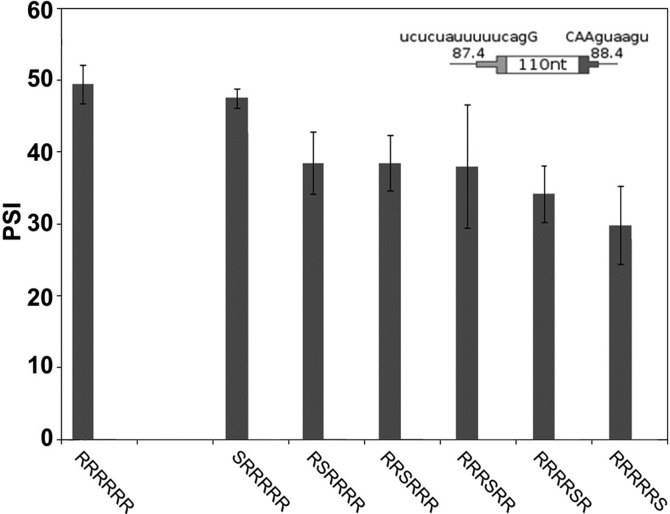
FIGURE 5.
Addition of a single ESS decreases inclusion level and shows some position dependence. The psi for DEs with a single ESS are shown for transient transfections. SS Set 5 was used. Error bars: SEM, n ≥ 3. An ESS at positions 2, 3, 5, or 6 reduced the psi significantly compared with no ESS (P ≤ 0.03). There was no effect at position 1 and variability at position 4 did not allow a conclusion. The cartoon shows the consensus values for splice sites used. See Supplemental Figure S4 for inclusion levels of DEs in a chromosomal context.

