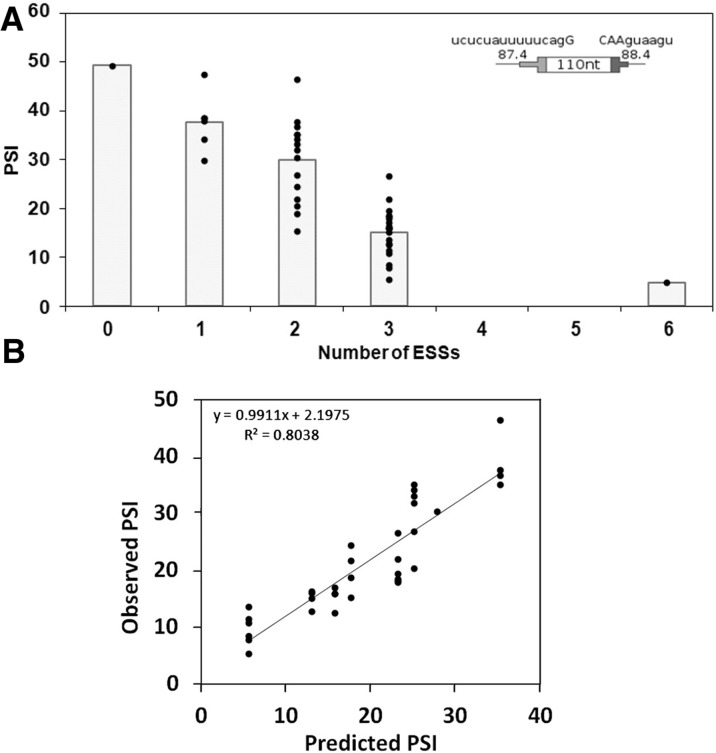
FIGURE 6.
Inclusion levels of DEs decrease with the number of ESSs present. (A) The psi for all possible permutations with 0, 1, 2, 3, or 6 ESSs were measured (n ≥ 3). SS Set 5 was used. The columns depict the average. Note that the data here are summarized using a column chart rather than a curve such as was used in Figure 4 for the ESEs. That curve was generated by a model that assumes position independence (see below), which is not the case for the ESSs. (B) The psi for all possible permutations with two and three ESSs were plotted against predictions based on the addition of the individual position effects of each ESS as measured in the single-ESS experiments (Fig. 5).

