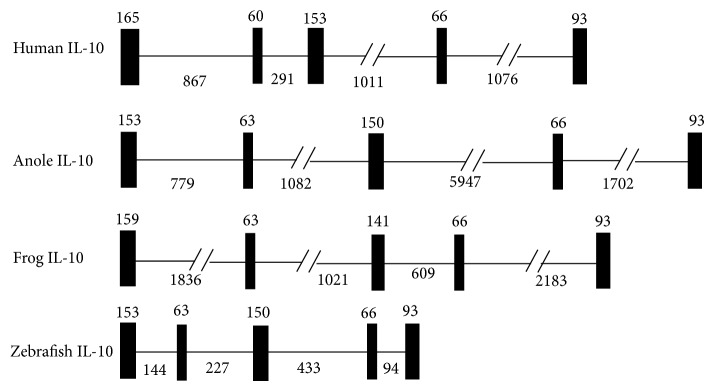
Figure 1.

Comparison of the gene organization of frog IL-10 gene with selected IL-10 molecules. The exons were indicated as black boxes and introns as black lines. The numbers above each box indicate the size (bp) of exons and the numbers below the lines indicate the size (bp) of introns. The gene organization of each gene was extracted from Ensembl Genome database.
