
Figure 3.
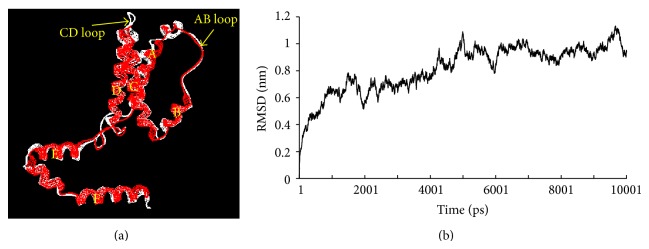
Structure and molecular dynamics analysis of frog IL-10. (a) Superimposition of the frog IL-10 model with the human IL-10 (PDB: 2ILK). Frog IL-10 was shown in red color and human IL-10 was in white color; (b) RMSD of frog IL-10 postmolecular dynamics for 12 ns. The MD analysis was performed by Gromacs 4.0 package [28] on an Inspur, 12 GHz PC, and results were analyzed using Origin 6.0 software.