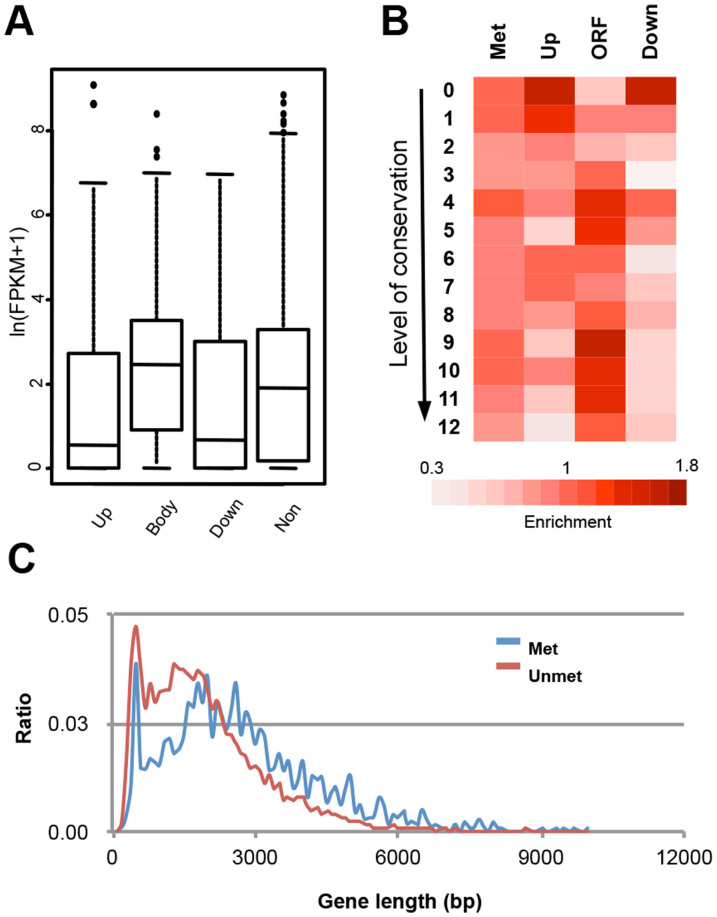
Figure 5. Relation between DNA methylation and transcription.
(A) Transcript abundance of mORFs and position of mCs. Up, upstream regions; Body, gene body; Down, downstream regions; Non, non-methylated genes. (B) Conservation level of mORFs and position of mCs. Conservation of a gene was measured by counting number of species where ortholgue(s) is found for a given gene throughout 13 species in Pezizomycotina (Figure S5). Proportion of genes that fall in each conservation category was shown relative to non-methylated genes. (C) Gene length distribution for genes with and without body methylation (blue and red lines, respectively).

