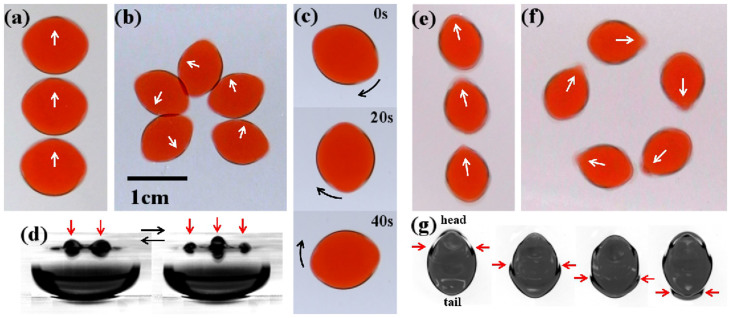
Figure 2. Top view of typical motion induced by standing wave.
(a–c, e, f) Arrows indicate the direction of motion. Time-lapse images of (a) straight motion, (b) rotational motion, and (e, f) squirming motion. Time series of (c) spinning motion. (d) Lateral view of a droplet with spinning motion. The horizontal axis is parallel to the long axis of the droplet. Arrows indicate the antinodes, and the number of antinodes Na = 5. (g) Top-view image of squirming motion captured by a high-speed camera. The red arrow indicates the peak of the traveling wave at the triple line. The droplet migrates upward. (a) ν = 170 mm2/s, f = 88 Hz, Vd = 0.6 ml, Γ = 75 m/s2. (b) ν = 400 mm2/s, f = 100 Hz, Vd = 0.3 ml, Γ = 112 m/s2. (c) ν = 400 mm2/s, f = 80 Hz, Vd = 0.6 ml, Γ = 63 m/s2. (d) ν = 400 mm2/s, f = 108 Hz, Vd = 0.6 ml, Γ = 84 m/s2. (e, f) ν = 37 mm2/s, f = 120 Hz, Vd = 0.3 ml, (e) Γ = 115 m/s2, (f) Γ = 123 m/s2. (g) ν = 37 mm2/s, f = 100 Hz, Vd = 0.66 ml, Γ = 79 m/s2.

