Figure 3.
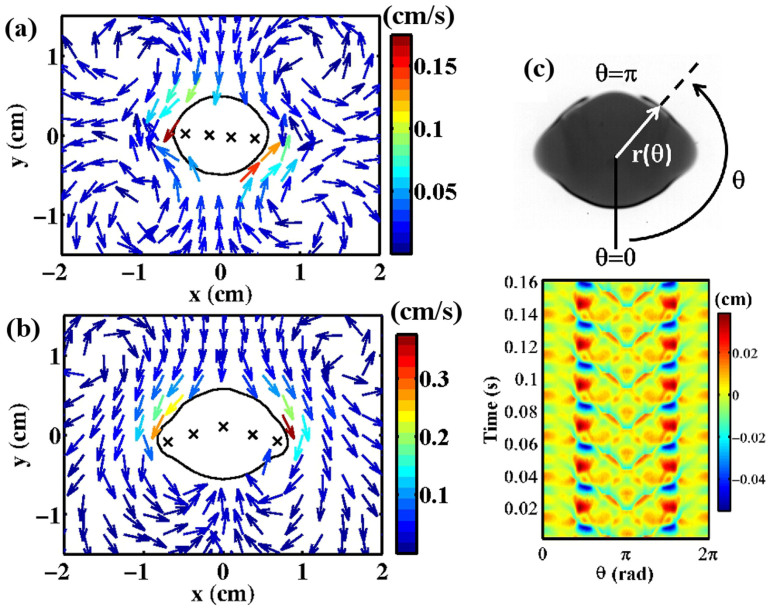
(a, b) Steady flow around droplet. The arrows indicate the flow direction and the color indicates the speed. Crosses indicate peak positions of the antinode. The coordinate axes are fixed on the droplet. (a) Spinning motion. The droplet spins clockwise. (b) Straight motion. The droplet migrates upward. (c) Color map image of the surface wave at the triple line. The color indicates the magnitude of the oscillation of the shape, δr = r(θ, t) − 〈r(θ, t)〉t (see Methods). For a straight motion, a standing surface wave is observed. (a–c) ν = 400 mm2/s, Vd = 0.6 ml, f = 80 Hz. (a) Γ = 67 m/s2. (b, c) Γ = 72 m/s2.

