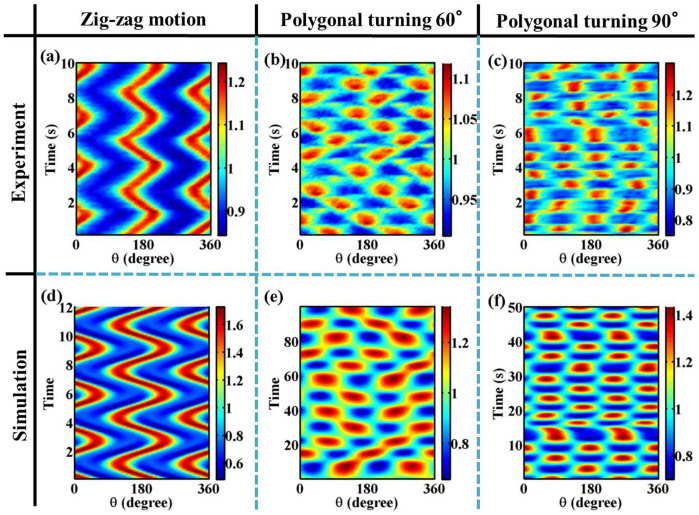
Figure 7. Spatio-temporal plots of r(θ, t) normalized by the radius.
In this figure, we show the slow dynamics of the shape. Red and blue colors represent the long and short axes, respectively. (a–c) Experimental results. (d–f) Simulation results. (a, d) Zigzag motion. (b, e) Irregular polygonal turning. Turning angle is 60°. (c, f) Irregular polygonal turning with a turning angle of 90°. (a) ν = 400 mm/s2, f = 93 Hz, Vd = 0.3 ml, Γ = 111 m/s2. (b) ν = 37 mm/s2, f = 120 Hz, Vd = 0.3 ml, Γ = 95 m/s2. (c) ν = 37 mm/s2, f = 90 Hz, Vd = 0.6 ml, Γ = 82 m/s2, and the temperature is 17.2°C. (d–f) The parameter values are defined in the SI. (d) The parameter values are κv = 0.3, α1 = −2.0, α3 = 8.0, μv = 1.0, κ2 = 1.5, β1 = 1.0, β3 = −8.0, β4 = −8.0, μ2 = 1.0, κ4 = 2.0, λ1 = 1.75, λ2 = −0.0625, the other values are zero. (e) κv = 0.14, α1 = −1.0, α2 = 0.188, μv = 4.0, κ2 = 0.12, β1 = 0.04, β2 = −6.0, μ2 = 1.0, κ3 = 0.05, ν1 = 0.3, μ3 = 4.0, the other values are zero. (f) κv = 0.11, α1 = −2.0, α3 = 4.0, μv = 1.0, κ2 = 0.4, β1 = 1.0, β3 = −4.0, β4 = −4.0, μ2 = 1.0, κ4 = 0.3, λ1 = 0.25, λ2 = −0.125, the other values are zero.

