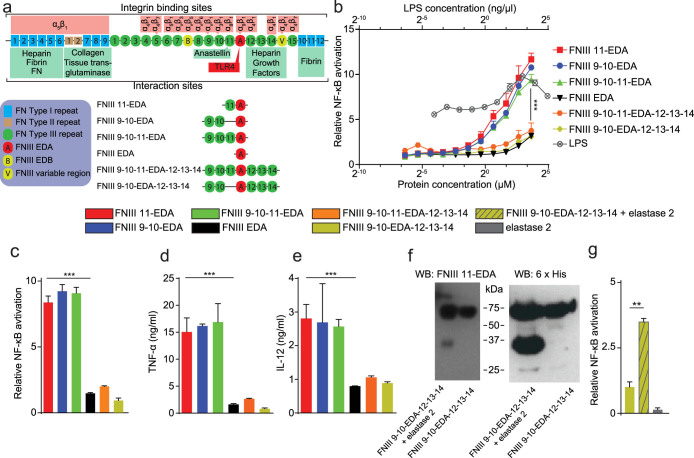
Figure 1. TLR4 activation by FNIII EDA is modulated by the context of its neighboring FNIII domains.
(a) FNIII EDA-containing FN fragments produced and of full length FN with some of its interaction sites displayed. (b) Activation of NF-κB in THP1-Blue cells as an indication of TLR agonization in response to various FNIII EDA-containing FN fragments, compared to LPS. The presence of a domain N-terminal to the FNIII EDA domain enhances activation, and the neighboring C-terminal domain abrogates activation. In the absence of the FNIII 12-13-14 domain, activation is comparable to that achieved by LPS. (c) Activation of NF-κB in HEK-Blue TLR4 cells as a cellular bioassay of TLR4 agonization. The presence of a domain N-terminal to the FNIII EDA domain enhances TLR4 agonization, and the neighboring C-terminal domain abrogates TLR4 agonization. In the absence of the FNIII 12-13-14 domain, TLR4 agonization is strong. (d, e) Production of TNF-α (d) or IL-12p70 (e) from murine bone marrow-derived DCs upon stimulation with various FNIII EDA-containing FN fragments. In DCs, the same pattern of activation was observed as with the previous cell lines: the presence of a domain N-terminal to the FNIII EDA domain enhances activation, and the neighboring FNIII 12-13-14 domain abrogates activation. (f) Western blots of the digestion product of FNIII 9-10-EDA-12-13-14 by elastase 2 and undigested control, blotted against the FNIII EDA domain (N-terminal to a predicted elastase 2 cleavage site) and a 6xHis tag (C-terminal). Cleavage was observed to yield two fragments of similar molecular weight, consistent with the presence of elastase 2 cleavage site at position 87 of the 94 amino acid-long FNIII EDA domain. (g) Activation of HEK-Blue TLR4 cells with the digested and undigested FNIII 9-10-EDA-12-13-14. Digestion of FNIII 9-10-EDA-12-13-14 with elastase 2 recovers activation, consistent with elastase 2-dependent cryptic agonization of TLR4. Cellular experiments in c, d, e and f were done in the presence of 10 μg/ml polymixin B, to avoid any influence of potentially contaminating LPS. In c, d, e and f, bars and curves represent mean ± SEM of triplicate cultures from two independent experiments. **P < 0.01; ***P < 0.001.

