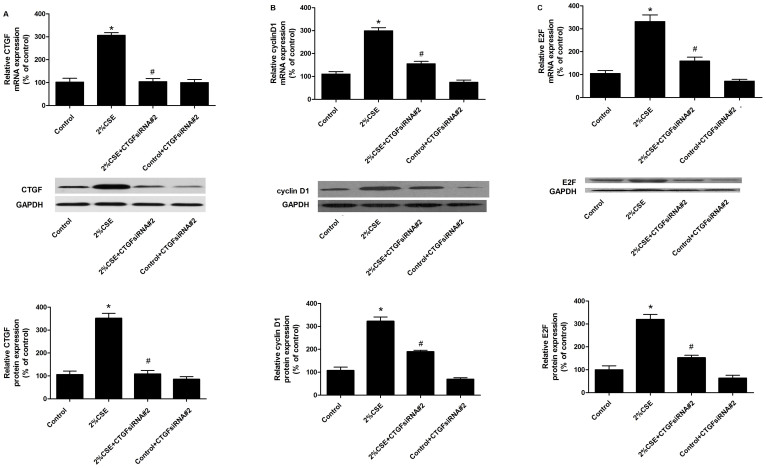
Figure 5. HPASMCs were treated with CSE and/or anti-CTGF siRNA#2 (#2, differently designed mRNA hit from #1), and the mRNA and protein expression levels were examined by real-time PCR and western blot.
(A). Upper panel: mRNA expression level of CTGF in the cells treated with control, CSE only, CSE plus anti-CTGF siRNA#2, and control plus anti-CTGF siRNA#2; Middle panel: Protein expression level of CTGF in the cells treated with control, CSE only, CSE plus anti-CTGF siRNA#2, and control plus anti-CTGF siRNA#2; Lower panel: Densitometry analysis of the western blots. (B). Upper panel: mRNA expression level of cyclin D1 in the cells treated with control, CSE only, CSE plus anti-CTGF siRNA#2, and control plus anti-CTGF siRNA#2; Middle panel: Protein expression level of cyclin D1 in the cells treated with control, CSE only, CSE plus anti-CTGF siRNA#2, and control plus anti-CTGF siRNA#2; Lower panel: Densitometry analysis of the western blots. (C). Upper panel: mRNA expression level of E2F in the cells treated with control, CSE only, CSE plus anti-CTGF siRNA#2, and control plus anti-CTGF siRNA#2; Middle panel: Protein expression level of E2F in the cells treated with control, CSE only, CSE plus anti-CTGF siRNA#2, and control plus anti-CTGF siRNA#2; Lower panel: Densitometry analysis of the western blots. *P < 0.05 versus control group; #P < 0.05 versus 2% CSE group.

