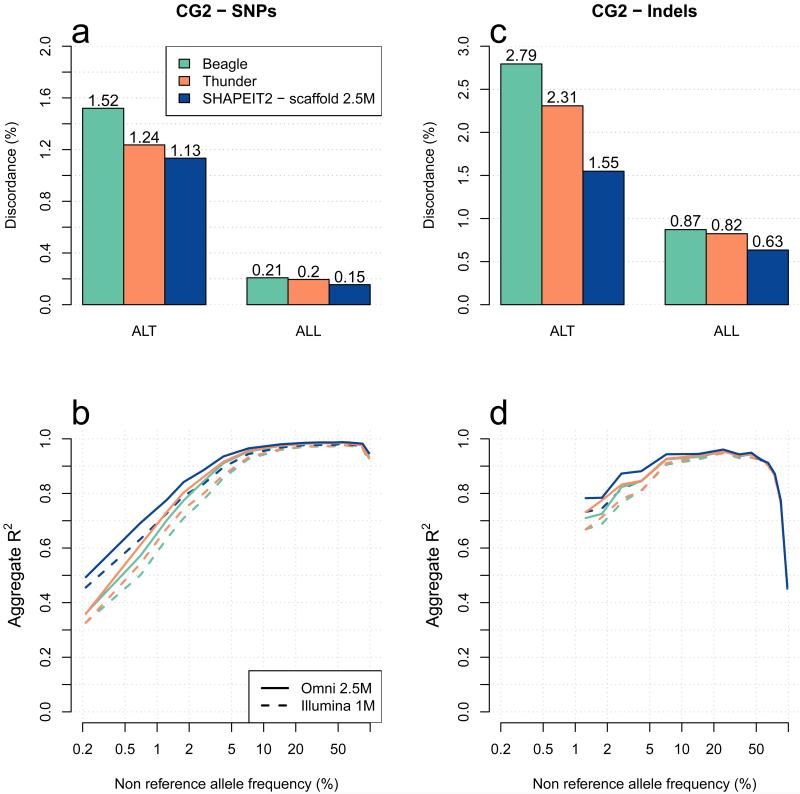
Figure 2. Methods comparison of genotype discordance and imputation accuracy using the CG2 data.
Panel (a) shows the whole genome genotype discordance of Beagle (green), Thunder (orange) and SHAPEIT2 using a 2.5M SNPs haplotype scaffold (dark blue) at CG2 SNPs. Panel (b) shows the performance of the 3 call sets to impute SNPs on chromosome 10 in 10 CG2 European samples typed on Illumina 1M and Omni2.5M chips. The x-axis shows the non-reference allele frequency of the SNP being imputed. The y-axis shows imputation accuracy measure by aggregate R2. Panels (c) and (d) show similar results than panels (a) and (b), respectively for short bi-allelic indels instead of SNPs.

