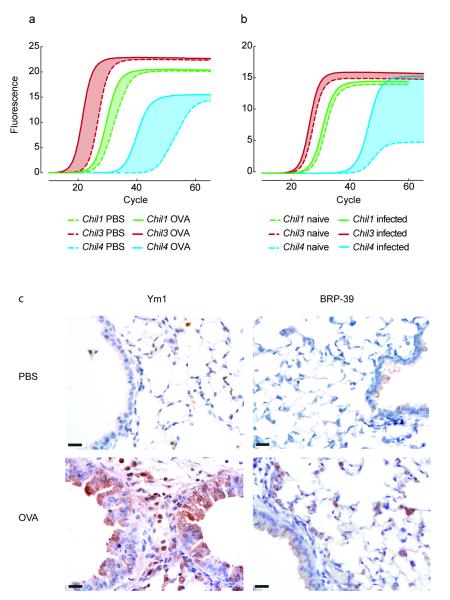
Figure 1. The expression of CLPs in the lungs of mice.
(a-b) mRNA amplification in lung tissue from PBS or OVA-challenged BALB/c mice (a) or uninfected or N. brasiliensis infected BALB/c mice (day 2 after infection) (b). Graphs show mean SYBR green fluorescence over cycle number with cycle number reflecting the relative abundance of the gene and the shaded area between the curves reflecting mean up-regulation of each gene. (c) Anti-Ym1 or anti-BRP-39 stained lung sections from PBS- or OVA-challenged mice. Scale bar, 20 μm. Data are representative of three independent experiments.

