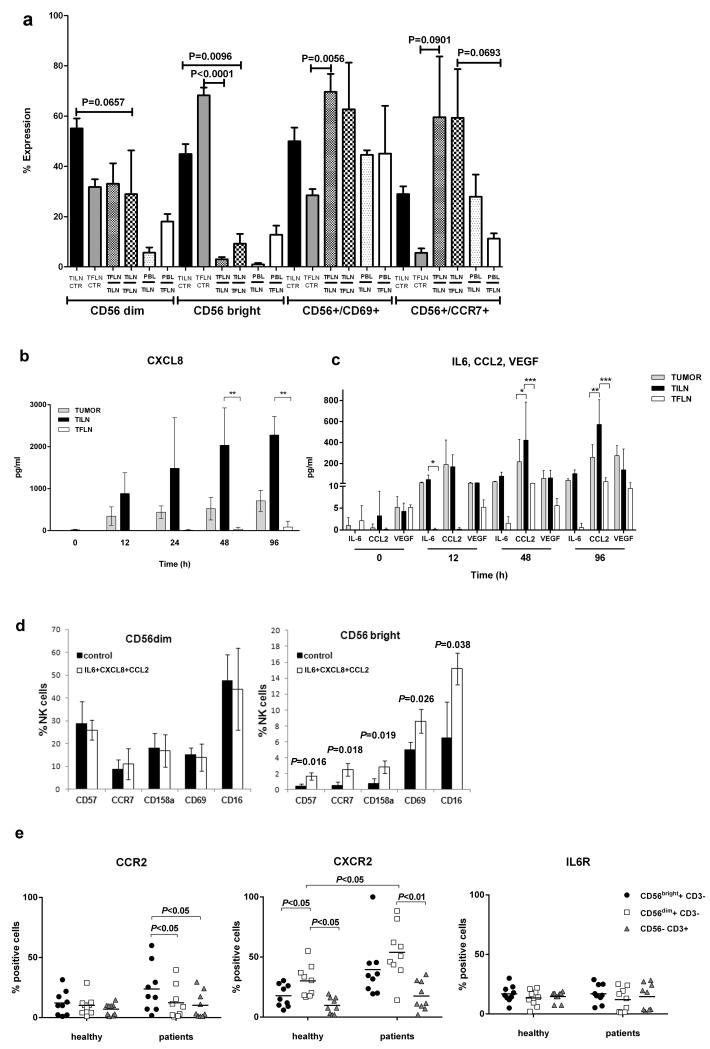
Figure 2. Analysis of cytokine milieau in melanoma infiltrated and tumor free lymph nodes.
(a) Transmissible factors’ influence on CD56 cell subset frequency and CD69 and CCR7 cell surface expression was evaluated in transwell cocultures. TILN and TFLN samples (n=3) were analysed for CD69 and CCR7 expression within CD56dim and CD56bright NK cell subsets. Each specific bar pattern represents the transwell condition with TFLN, TILN or PBL in the upper chamber of the transwell and TFLN or TILN in the lower one. The bar diagram shows the mean of values ± SD (ANOVA, n=3). (b, c) Cytokine production in supernatant of TILN, TFLN and melanoma tumor samples. The histogram reports CXCL8 production by tumor cells (grey column), TILN lymphocytes (black column) and TFLN lymphocytes (white column) as mean±SD of three independent experiments (b). IL-6, CCL2, VEGF release by tumor cells, TILN and TFLN lymphocytes (the results represent mean±SD of three separate experiments, ANOVA) (c). (d) The combination of IL6, CXCL8 and CCL2 can influence CD56bright phenotype on CD56+CD3− NK cells derived from peripheral blood of healthy donors. Bars shows the percentage ± SD of CD56dim (left panel) and CD56bright (right panel) expressing each indicated marker. Results shown are representative of three independent experiments. Statistical analysis is indicated (ANOVA). (e) Frequency of NK and T cell subsets (CD56bright+CD3−; CD56dim+CD3−; CD56-CD3+) expressing the CXCL8 receptor (CXCR2), CCL2 receptor (CCR2) and IL6 receptors in healthy donors (n=8) and melanoma patients peripheral blood (n=9). Each dot represents a different patient or healthy donor. Bars represent mean values. Statistical analysis is indicated (ANOVA).

