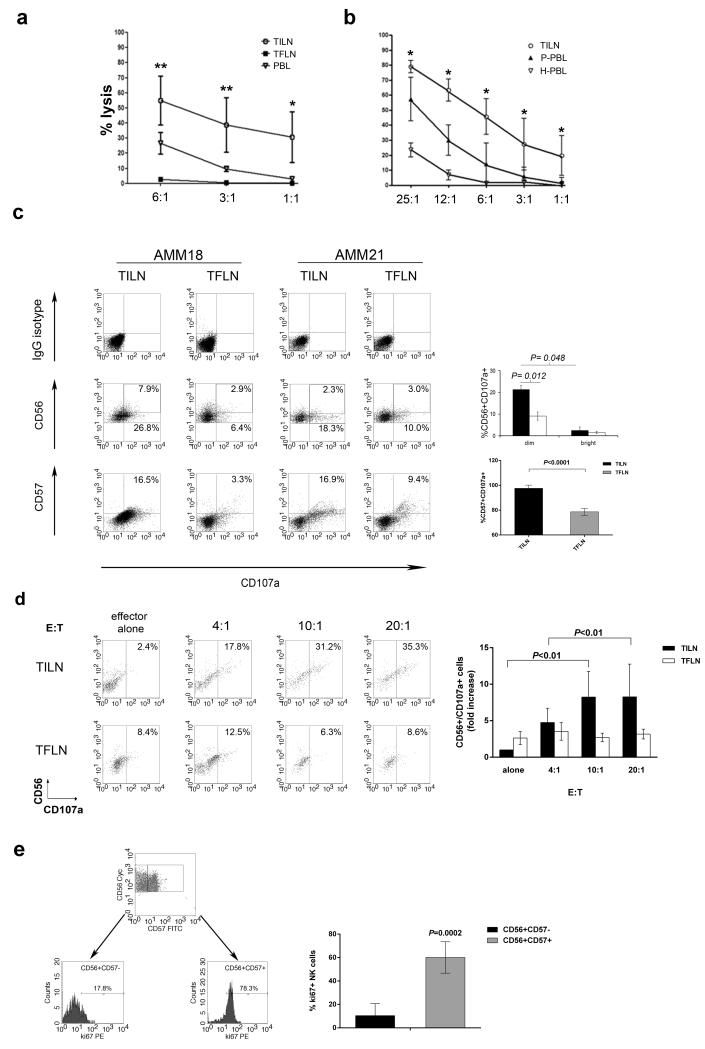
Figure 3. NK cells from tumor-infiltrated lymph nodes have strong cytotoxic potential.
(a, b) Cytotoxicity of NK cells against autologous melanoma cell lines. The graph reports the mean percentage specific lysis ±SD of at least 3 individual representative experiments performed at the indicated Effector:Target (E:T) ratios. The figure compares killing by autologous NK cells isolated from patients’ TILN (circle symbol) and TFLN (black square) or allogenic NK cells isolated from healthy donors’ PBL (H-PBL, black triangle) (a). Comparison between cytotoxicity of autologous NK cells isolated from TILN (circle symbol, n=6), patients’ PBL (P-PBL, black triangle, n=4) and allogenic NK cells isolated from healthy donors’ PBL (H-PBL, white triangle, n=4) (b). Statistical analysis is indicated (ANOVA). (c) Basal CD107a surface expression on TILN- and TFLN-NK cells from 2 representative (AMM18 and AMM21) patients, as assessed by FACS analysis. Numbers in dot plots indicate the percentage of CD107a positive cells within CD56dim and CD56bright NK subsets (upper panels) or alternatively within CD57+CD56+ NK cells (lower panels). The dot plot quadrants are set according to the isotype IgG control for TILN and TFLN as shown in the figure. In the CD56 dot plots two additional regions identify bright and dim NK cell subsets. The bar diagrams (right) refer to the mean of values ± SD of experiments performed in 5 metastatic melanoma patients (ANOVA). (d) Two representative metastatic melanoma patients (AMM17 on the left and AMM20 on the right) FACS analysis of the CD107a mobilization assay gating on CD56+CD3− TILN and TFLN NK cells after K562 pulsing at different E:T ratios. Quadrants are drawn according to the IgG isotype control for TILN and TFLN, as shown. The bar diagram (right) shows the mean of values ± SD (n=4) expressed as fold increase of CD107a expression in target pulsed NK cells over NK cells alone. (e) Ki67 intracellular staining TILN CD57+CD56+ NK. The bar diagram (right) shows the mean of values ± SD (n=5).

