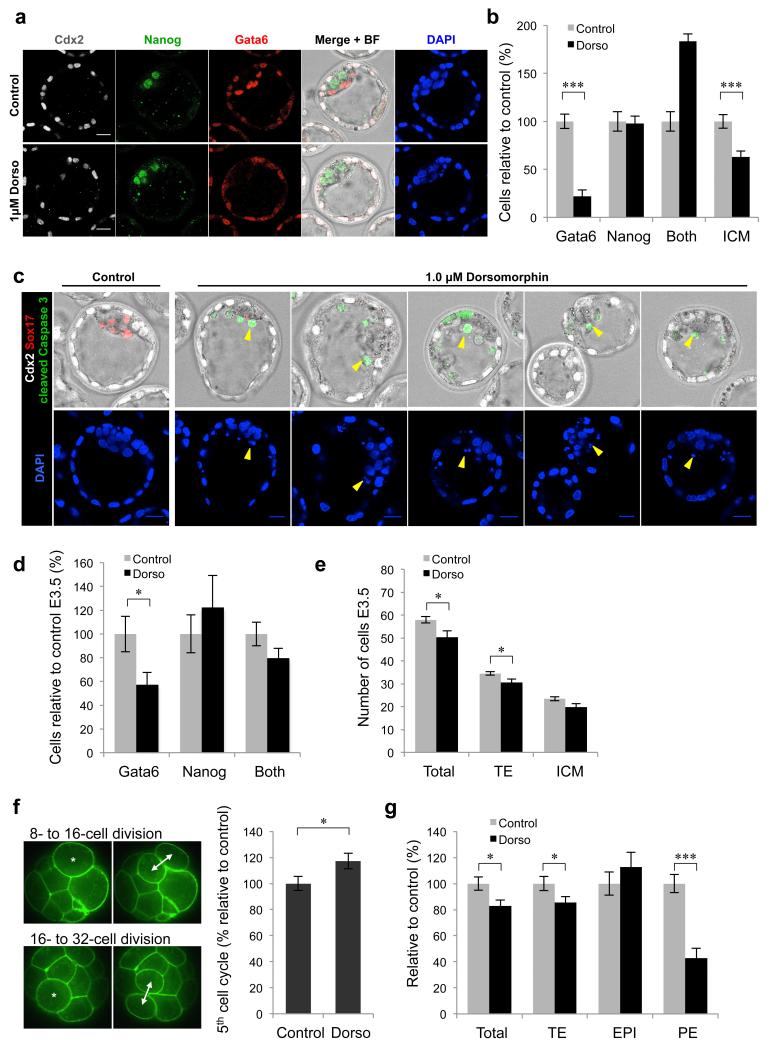
Figure 5. Mechanism of PE cell loss in Dorsomorphin-treated embryos.
(a-c) Embryos were treated with 1.0 μM Dorsomorphin (n = 15) for 48 hours from E2.5 to E4.5 (controls n = 15). (a) Expression of Cdx2, Gata6 and Nanog at E4.5. (b) Number of cells relative to controls at E4.5. Both = positive for Gata6 and Nanog. (c) Examples of dying cells on surface of ICM (identified by cleaved Caspase 3 expression and DNA fragments, yellow arrows) at E4.5. (d-e) Embryos were cultured in the presence of 1.0 μM Dorsomorphin (n = 16) for 24 hours from E2.5 to E3.5 (controls n = 16). (d) Number of cells relative to controls at E3.5. (e) Number of cells in each lineage at E3.5. (f) Time taken for individual cells to complete the fifth cell cycle in embryos cultured with 1.0 μM Dorsomorphin (n = 17 cells, 6 embryos) for 48 hours from E2.5, relative to controls (n = 23 cells, 5 embryos). (g) Number of cells in each lineage relative to controls at E4.5 following treatment with 1.0 μM Dorsomorphin for 24 hours from E3.5. Scale bars = 20 μm. * denotes p < 0.05, *** denotes p < 0.001 (Student’s t-test). Error bars represent s.e.m. See also Supplementary Fig. 4.

