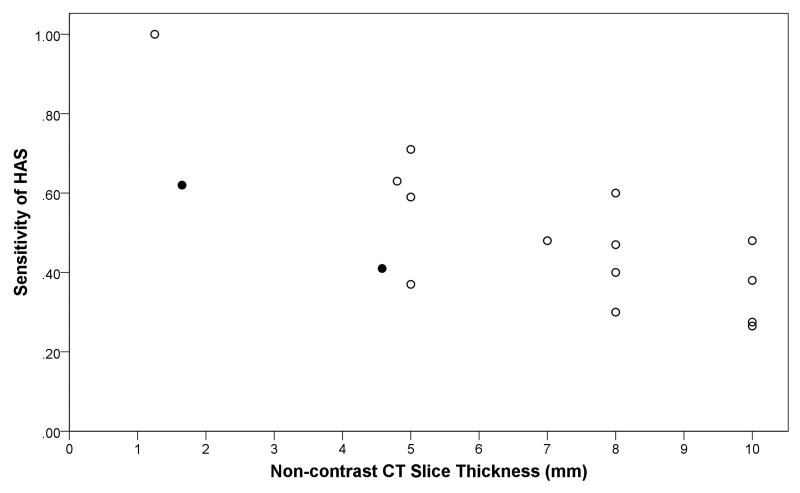
Figure 2.
Relationship between the sensitivity of a hyperdense artery sign (HAS) for arterial obstruction and non-contrast CT slice thickness
Footnote: Closed dots represent IST-3 data (thin-slice ≤3mm, mean 1.65mm; thick-slice >3mm, mean 4.5mm). Open dots represent results from articles identified on systematic review. Two dots have been fractionally altered to reveal identical results (sensitivity = 0.27, slice thickness = 10mm). Correlation is r=−0.73, p=0.001.

