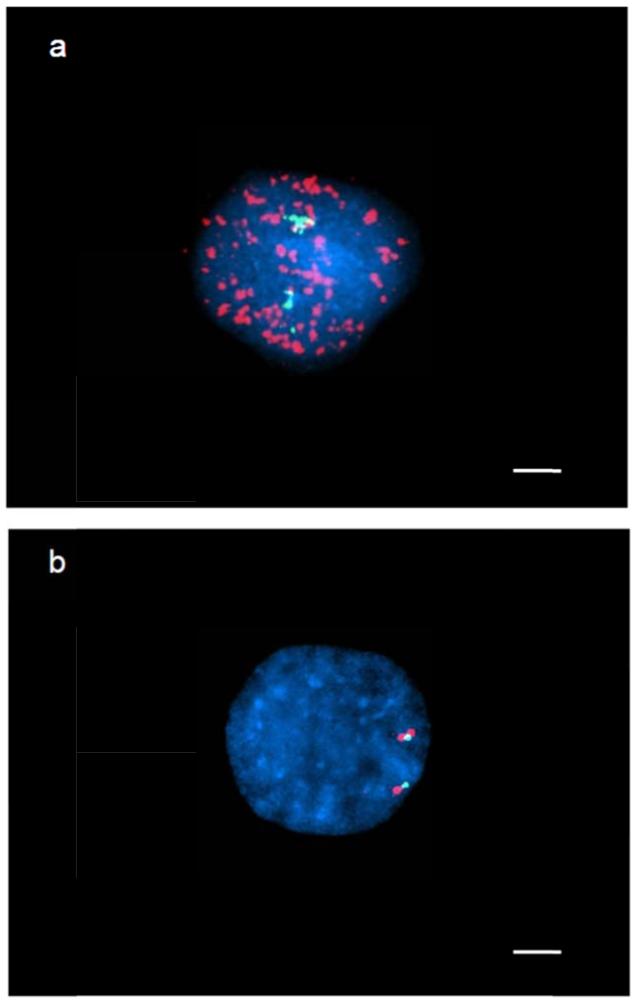
Figure 2. FISH analysis for the detection of EGFR amplification in GBM IV-19 cells.
a. FISH in primary tumor cells demonstrates euploid chromosome 7 (green signal) and multiple copies of EGFR scattered all over the nucleus (red signal). b. Cultured tumor cells shows euploid chromosome 7 in green and not amplified EGFR (red signal). Scale bar = 5μm.

