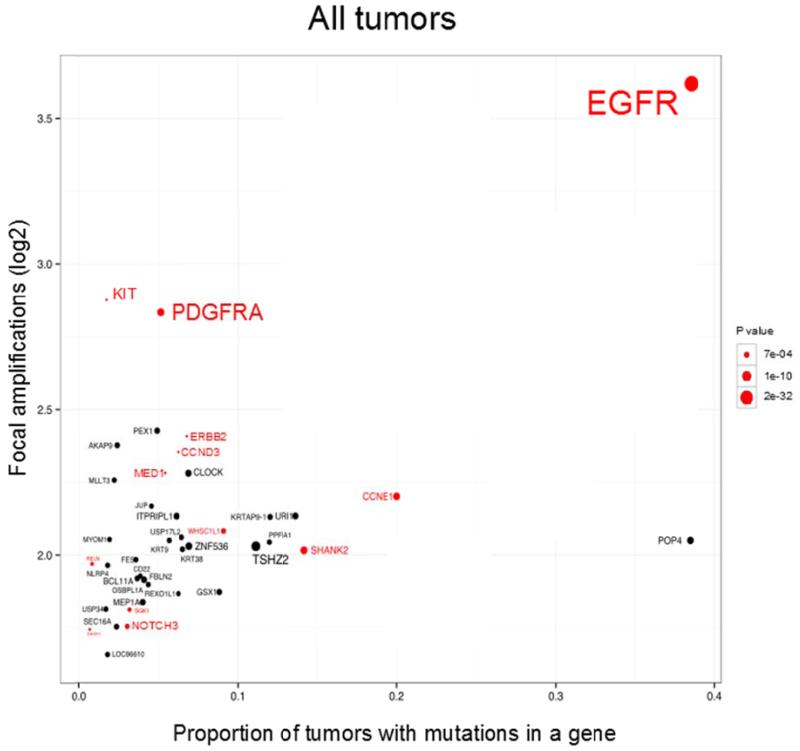
Figure 5. Co-localizations of mutations and amplifications on gene-by-gene basis across 17 tumor types and N=4198 tumor samples.
X-axis - proportion of mutations in Focal Amplifications, Y-axis - log2 of the average copy number in FAs. The area in circle is inversely proportional to the log2 of the log2 of the P value (Fisher test). All oncogenes are selected in red. All oncogenes are presented if they have at least one mutation in FAs and a P value less than 0.15, the other genes are presented if they have at least 2 mutations in FAs and P value less than 0.01.

