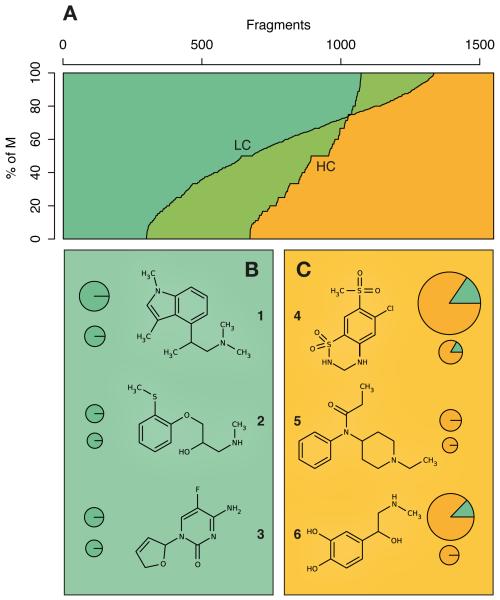
Figure 2. Privileged and liable structures.
(A) Balance between privileged and liable structures, both for the HC and LC sets. % of M indicates the proportion of M associations for each fragment over its disease associations. (B) Three scaffolds that, while being mostly liable, are included in drug molecules. (C) Fragments that are privileged and remain unsuccessful or unexplored as therapeutics. Next to each structure, top and bottom pie charts represent the number of diseases for which the fragment is LC- and HC-associated, respectively. Area of pie charts is proportional to the number of diseases. To select these examples, experimental and approved drug structures were extracted from Drugbank (July 2013)21.

