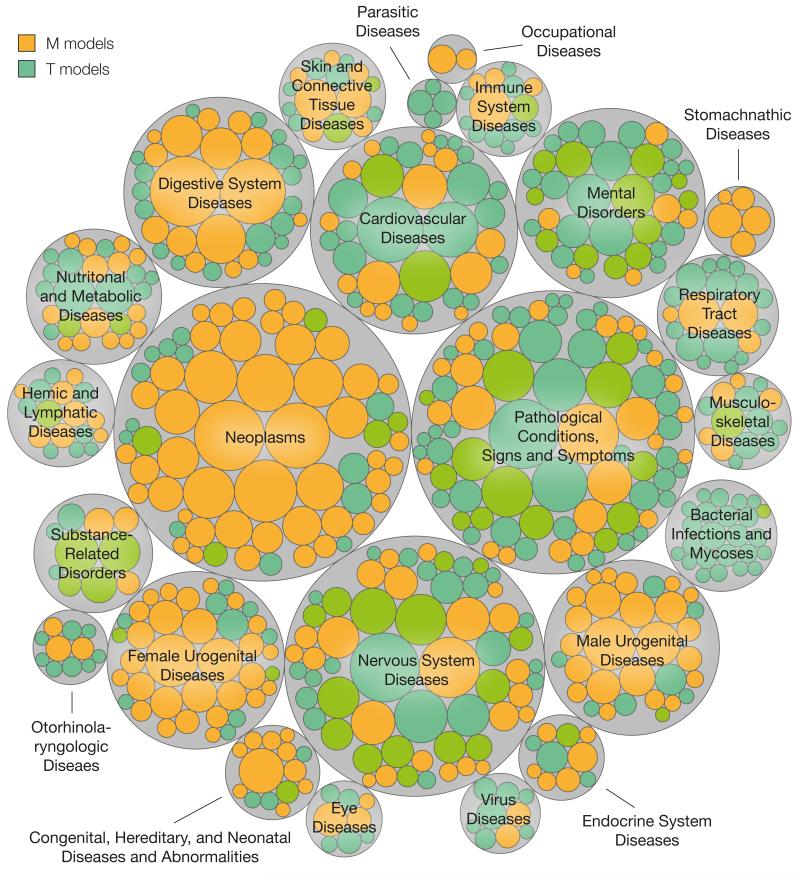
Figure 4. Disease categories of successful models.
M and T plausible disease models classified in high-level disease categories. Each circle represents an M or T disease model belonging to the corresponding category. Area of circles is proportional to the number of associated molecules in our dataset.

