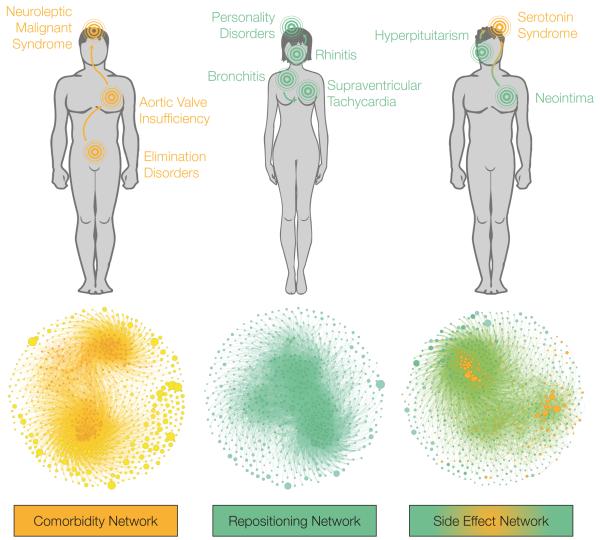
Figure 5. Disease networks.
Disease comorbidity, drug repositioning and drug side effect networks. Examples discussed in the text are depicted with directed links on top of each network. To select these examples, we looked for strong correlations (see Materials and Methods) occurring between diseases in different categories. None of the cases share annotated chemicals, highlighting the value of our fragment-based models. Networks are displayed with a gravity layout, being node size proportional to the number of related chemicals. Network statistics can be found in Table 2.

