
Figure 2. Virus particle alignment and model-based analysis.
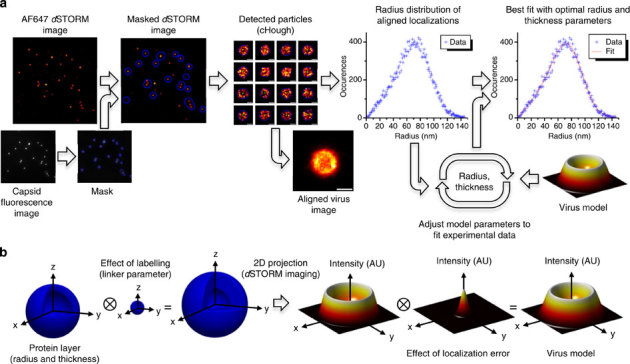
(a) Flowchart representing the main data analysis steps. The image analysis procedure was performed using a custom-written MATLAB routine. Briefly, the dSTORM image was masked using the mTurquoise and AF568 fluorescence image, and the circular Hough (cHough) transform was applied to detect the particles and determine their centres. The radial distribution of localization is obtained from the aligned localizations and then fitted to the MCV model. (b) MCV model. The effect of the labelling linker, the imaging (projection) and the localization error are taken into account. The ⊗ symbol represents the convolution operation (for more details, see Supplementary Notes 1–3).