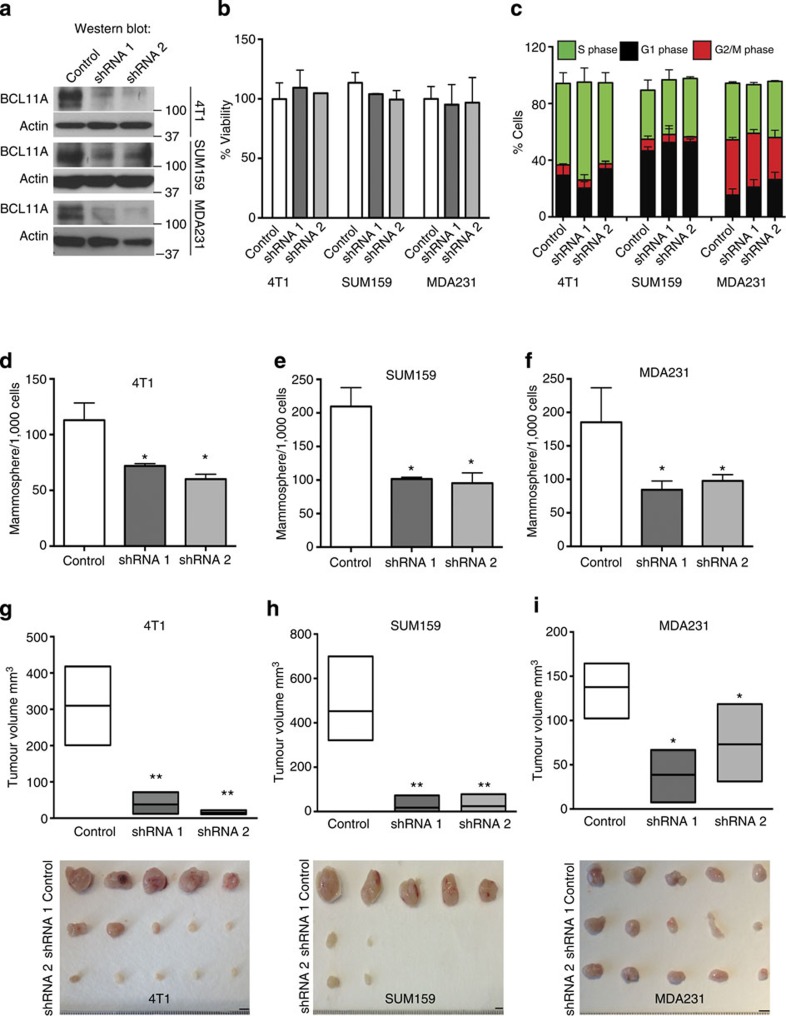
Figure 4. BCL11A knockdown in TNBC cells reduces tumour development.
(a) Western blot showing BCL11A knockdown efficiency in 4T1, SUM159 and MDA231 cells transfected with control (scramble), shRNA1 or shRNA2 vectors. (b) MTS cell viability assay (see Methods) shows that BCL11A knockdown does not affect cell viability in culture. (c) EdU cell cycle analysis showing that Bcl11a knockdown does not affect cell cycle kinetics in all tested cell lines. Data are presented as mean±s.d. (n=3). (d–f) Comparison of colony numbers from control, shRNA1 and shRNA2 in 4T1, SUM159 and MDA231 cells. Data are presented as mean±s.d. (n=3). P value indicates student’s t-test. (g–i) Graph depicting the reduction in tumour size observed when shRNA1 or shRNA 2 transfected 4T1, SUM159 or MDA231 cells are injected subcutaneously into mice compared with control. Image under graph shows the actual tumours measured (scale bar, 5 mm). Unpaired T-test was performed on d–i and * indicates P<0.05 and ** indicates P<0.005.

