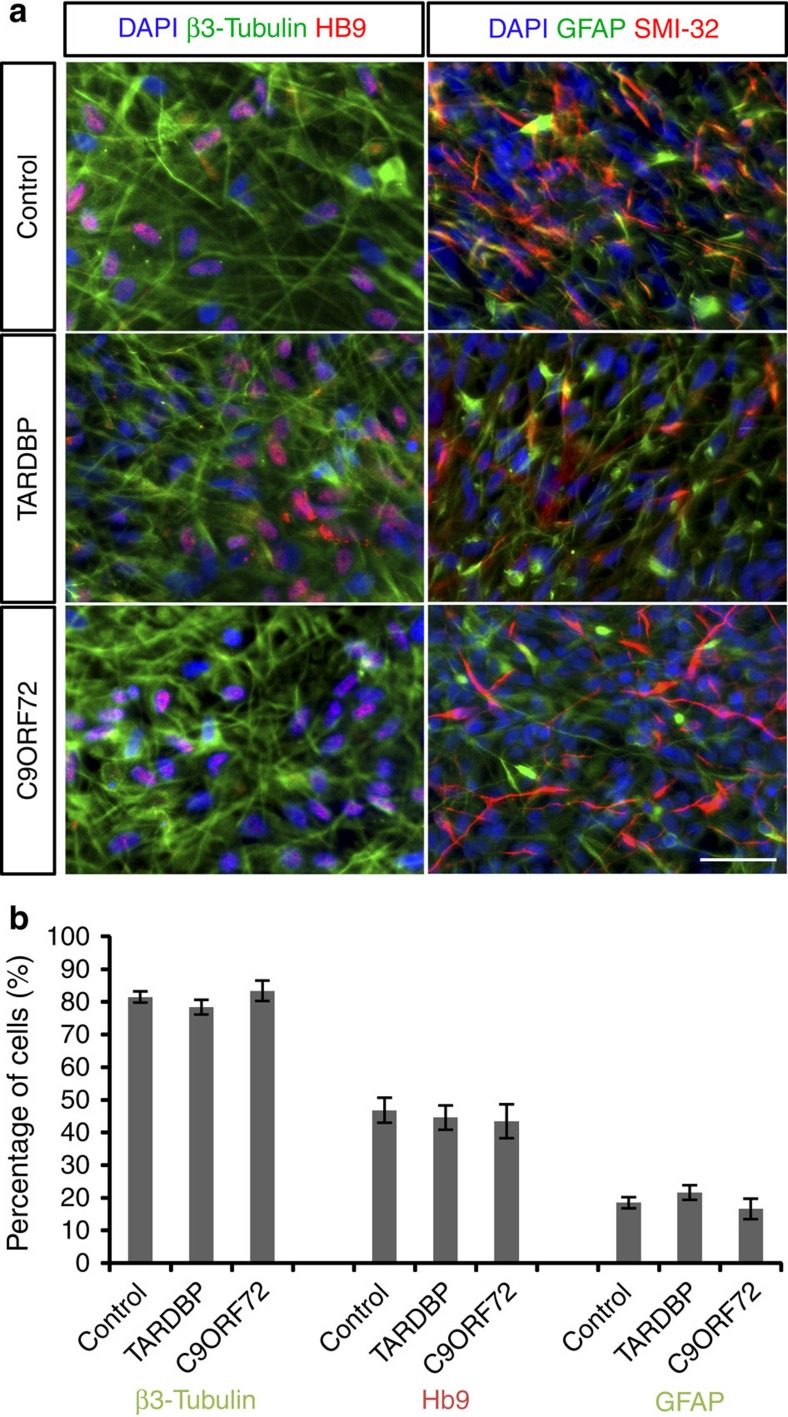
Figure 1. Differentiation of MNs from control and patient iPSC lines.
(a) Immunohistochemical staining of differentiated iPSCs (control, TARDBP and C9ORF72 lines) using antibodies raised against β3-tubulin, Hb9, SMI-32 and glial fibrillary acidic protein (GFAP). (b) Proportion of differentiated iPSCs expressing β3-tubulin, Hb9 and GFAP (total cells counted: control, 1,126 cells; TARDBP, 1,224 cells; C9ORF72, 1,534 cells; scale bar, 50 μm).

