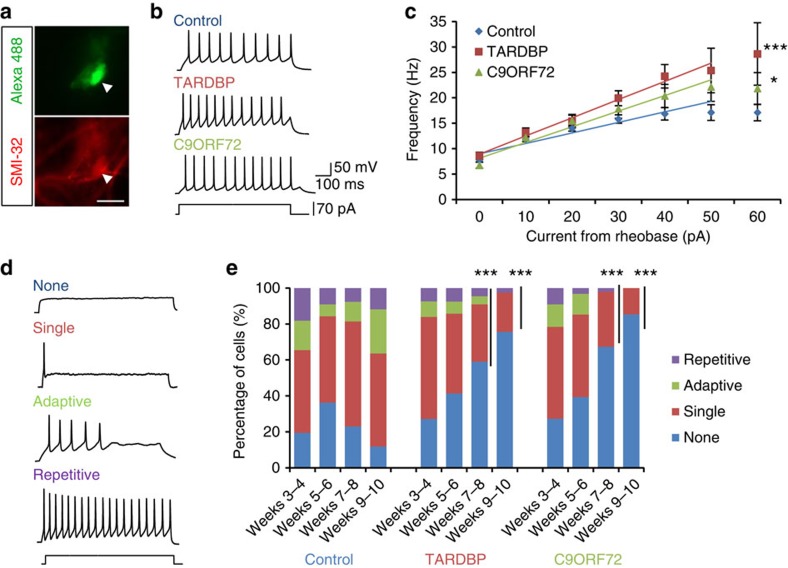
Figure 3. Hyperexcitability followed by loss of action potential output in patient iPSC-derived MNs.
(a) Fluorescent image of a cell filled with Alexa Fluor 488 dye during whole-cell patch-clamp recordings and immunolabelling with an antibody raised against SMI-32 (arrow heads point to cell soma; scale bar, 10 μm). (b) Repetitive firing in response to square current injection in iPSC-derived MNs from control, TARDBP and C9ORF72 lines. (c) Frequency-current (f–I) relationships generated for repetitively firing iPSC-derived MNs from control (n=62), TARDBP (n=19) and C9ORF72 (n=19) lines recorded from weeks 2–6 post plating (data are plotted as  with lines of best fit; *significantly different to control, P<0.05; ***significantly different to control, P<0.0001; linear model with multiple contrast for the gradient values, and adjusted with Bonferroni correction). (d) Examples of the four categories of firing observed in iPSC-derived MNs (repetitive, adaptive, single or no firing). (e) Proportion of cells exhibiting each firing category in iPSC-derived MNs from control (n=702), TARDBP (n=380) and C9ORF72 (n=239) lines across weeks 3–10 post plating (***significantly different to control, P<0.0001; logistic regression with multiple Wald’s test and Bonferroni correction).

