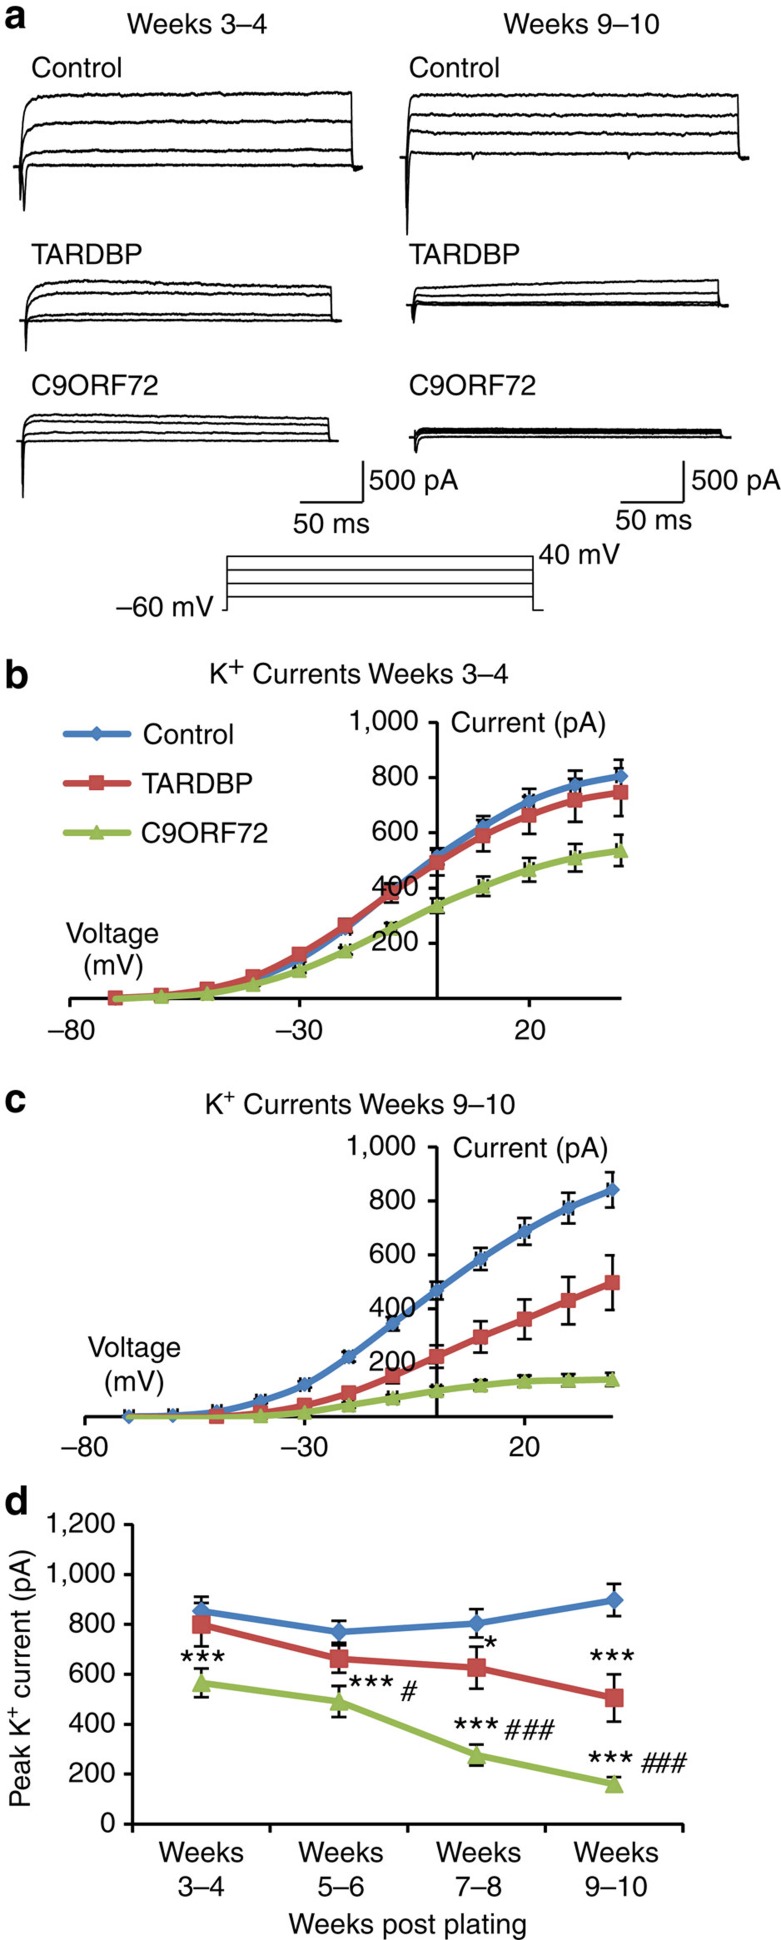
Figure 6. Loss of persistent voltage-activated K+ currents in patient iPSC-derived MNs.
(a) Raw data showing persistent K+ currents in control, TARDBP and C9ORF72 iPSC-derived MNs at week 3–4 and weeks 9–10. (b) Current–voltage relationships of peak K+ currents recorded from control and patient iPSC-derived MNs at weeks 3–4. (c) Current–voltage relationships of peak K+ currents recorded from control and patient iPSC-derived MNs at weeks 9–10. (d) Peak K+ currents plotted from weeks 3–10 for control (n=847), TARDBP (n=452) and C9ORF72 (n=264) iPSC-derived MNs (data are plotted as  ; *significantly different to control, P<0.05; ***significantly different to control, P<0.0001; #significant difference between patient lines, P<0.05; ###significant difference between patient lines, P<0.0001; linear model with multiple Wald’s tests and Bonferroni correction).

