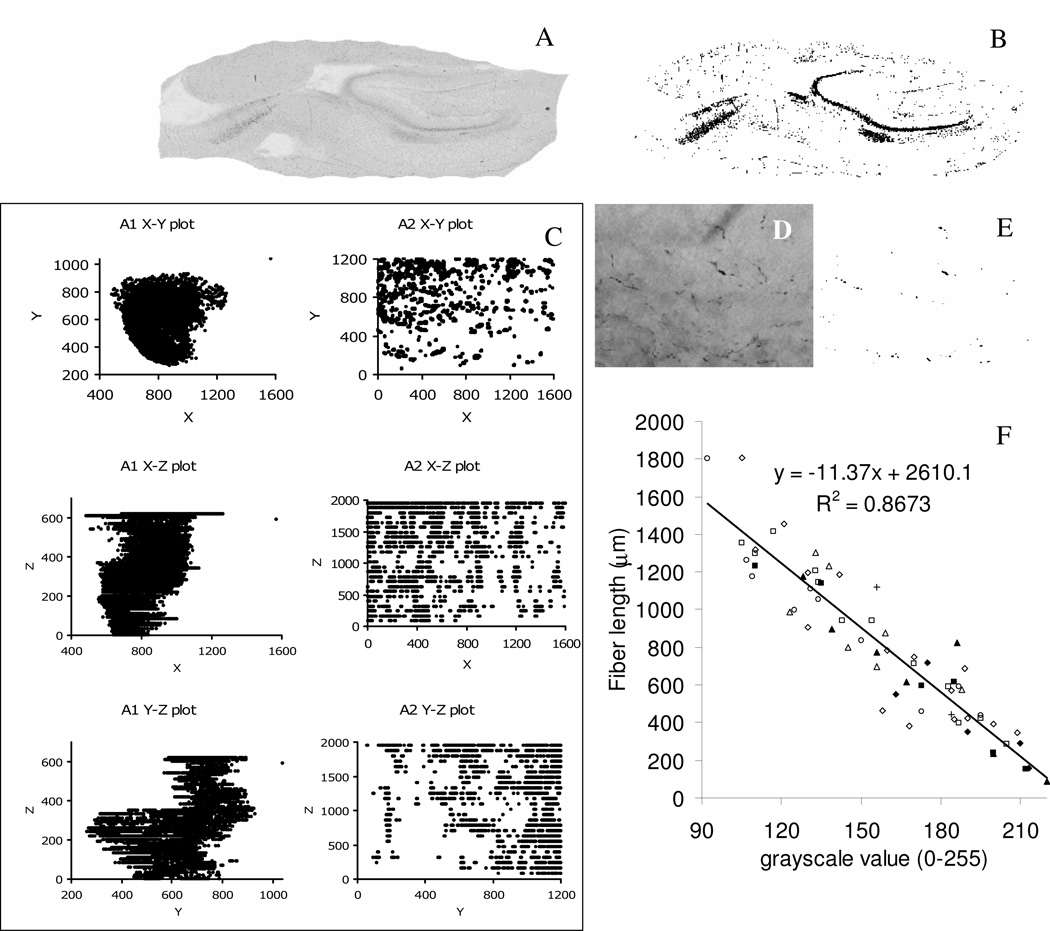
Figure 1.
(A) Grayscale single sagittal section of set A1 and its thresholded image (B); (C) grayscale single sagittal section of set A2 and its thresholded image (D); (E) stereological correlation between the 2× grayscale value and fiber length computed at 100× in the same region of interest, for 65 unique locations. Different symbols represent different sections (filled and empty symbols correspond to experiments 1 and 3, respectively). (F) 2D X-Y-Z plots (all units are in pixels) of down sampled sets A1 and A2 (XY corresponds to the sagittal plane for both sets).

