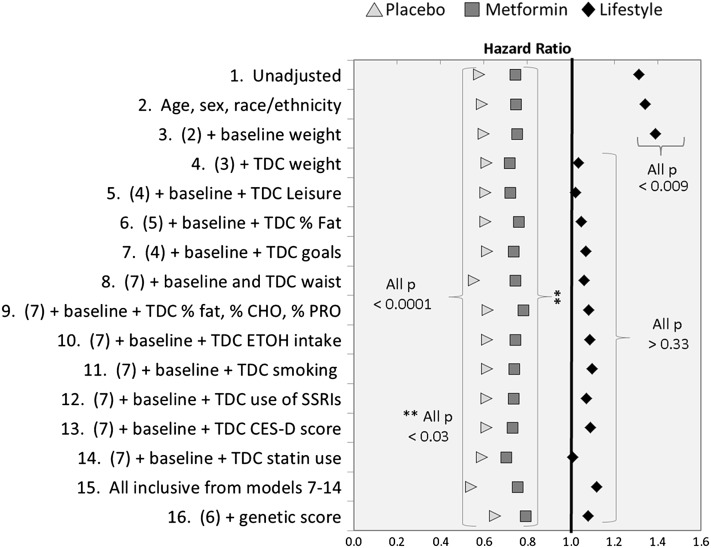
Figure 2.
HRs for the DPPOS to DPP time period, by treatment group using sequential adjustment for risk factors. CES-D, Center for Epidemiologic Studies of Depression score; % CHO, percentage of calories from carbohydrate; ETOH, alcohol intake; % fat, percentage of calories from fat; goals, number of five study goals met; waist, waist circumference; % PRO, percentage of calories from protein; smoking, current, former, never cigarette smoker; SSRI, selective serotonin reuptake inhibitors; statin, HMG-CoA reductase inhibitors; TDC, time-dependent covariate; leisure, leisure time physical activity. Model 1 is unadjusted; model 2 is model 1 plus the factors listed.

