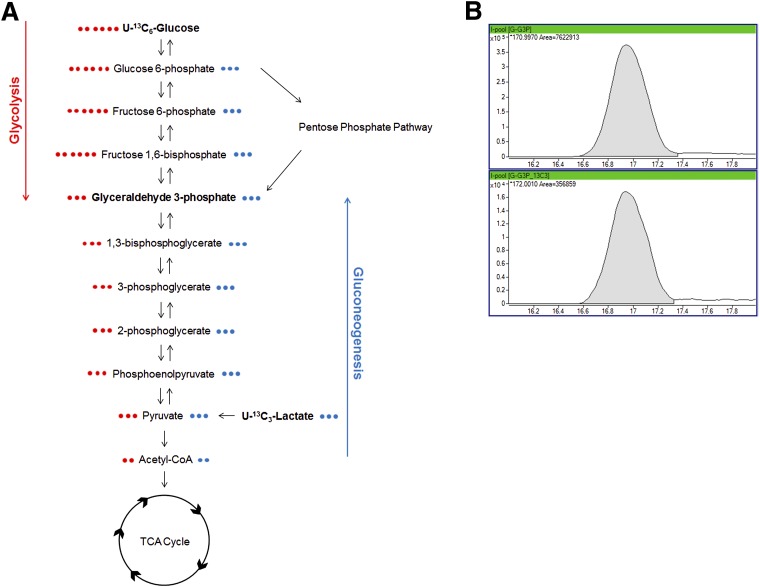
Figure 2.
MFA of isotope tracers into glyceraldehyde 3-phosphate (G3P). A: Schematic depicting isotope incorporation into G3P using either U-[13C6]glucose or U-[13C3]lactate. With each isotope-labeled substance, G3P derived from glycolysis or gluconeogenesis, respectively, would have a mass shift of +3 due to all three carbons incorporating the 13C label. Comparison of percent incorporation following addition of U-[13C6]glucose or U-[13C3]lactate would allow for the determination of how much G3P is derived from each pathway. Characterization of each metabolite in the pathway (G6P, F6P, FBP, TCA cycle metabolites, etc.) could help identify blockages in each metabolic pathway. B: MS/MS spectrum of [12C]G3P (top panel) and [13C3]G3P (bottom panel) in the liver following treatment with U-[13C6]glucose. The area of G3P m+3 (bottom panel) divided by the sum of the total, following correction for naturally occurring 13C isotopes, gives the percent of G3P derived from glycolysis following the addition of U-[13C6]glucose.

