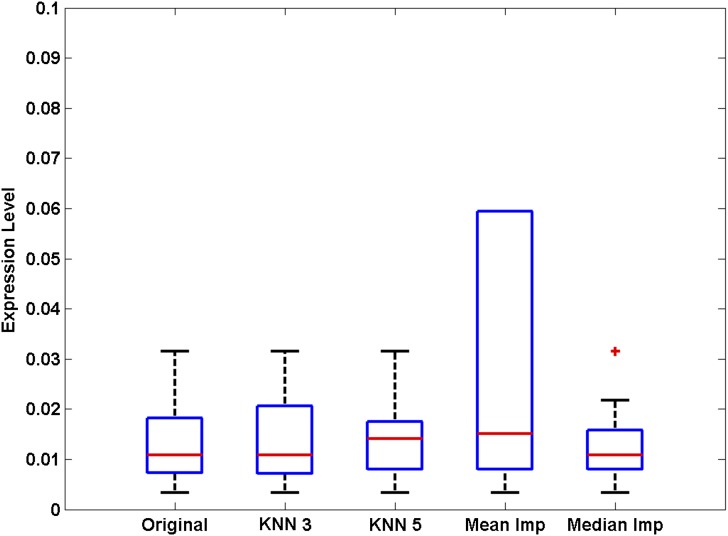
Figure 3.
Comparison of imputation methods for missing values. Methionine concentrations in urine were determined by GC-MS, and 5 out of 27 control subjects had values below the limit of detection. Data were log2 transformed and analyzed using different imputation methods for the missing values (three nearest neighbors [KNN 3], five nearest neighbors [KNN 5], metabolite mean value [Mean Imp], or metabolite median value [Median Imp]). The median and variance for each imputation method is shown. KNN 3 had the smallest effect on data distribution. +, outlier.

