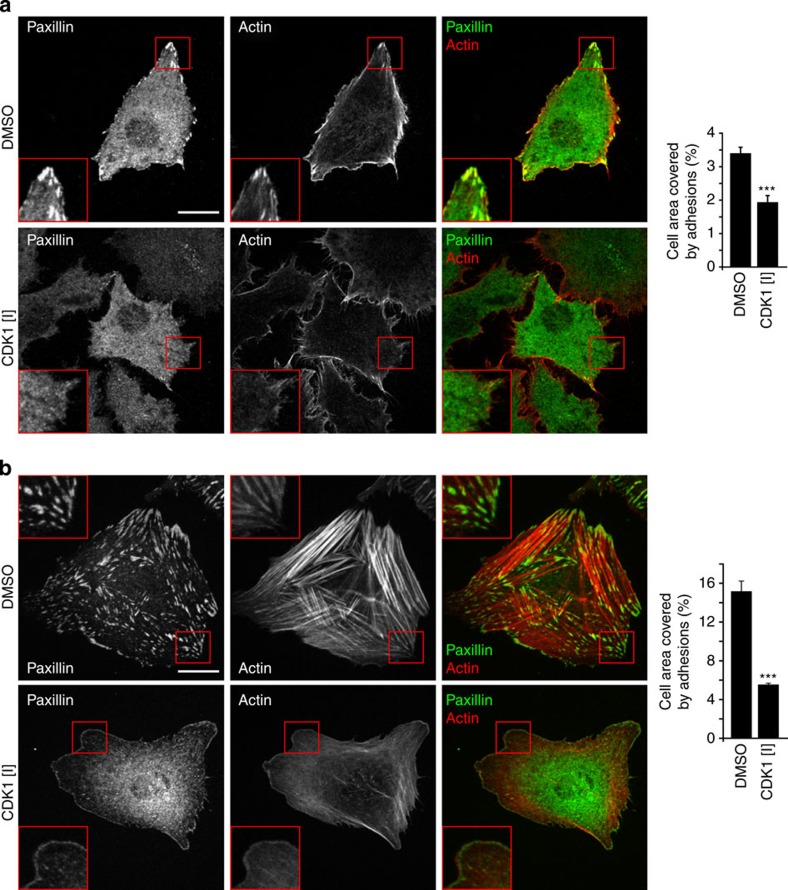
Figure 6. Effect of CDK1 inhibition on cell adhesion.
A375 cells (a) and HFFs (b) were spread on FN for 60 min before treatment with the CDK1-specific inhibitor RO-3306 (CDK [I]) or DMSO for 60 min. Adhesion sites were visualized by immunofluorescence staining for paxillin (green) and the actin cytoskeleton was visualized by staining with Texas Red-conjugated phalloidin (red). For both cell types, the cell area covered by adhesion sites was quantified and is displayed to the right of immunofluorescence images (n=3, quantification based on 60 cells for each cell type). Scale bar, 20 μm. Error bars represent s.e.m. (***P<0.005; Student’s t-test).

