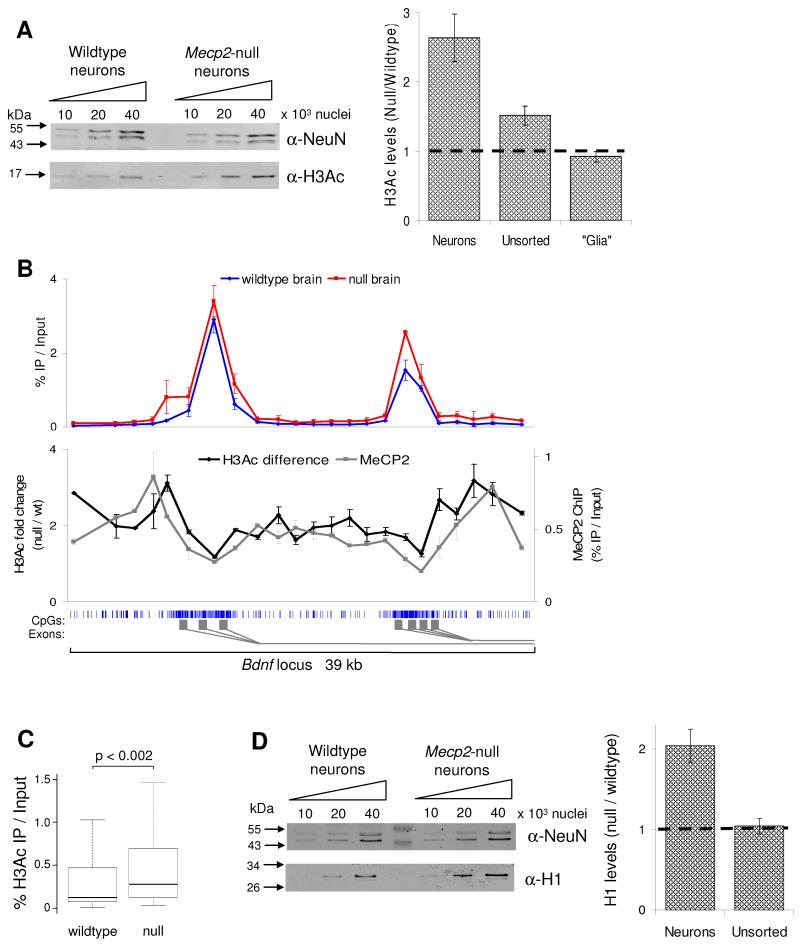
Fig 5.
MeCP2-deficiency affects the global chromatin state by elevating levels of histone H3 acetylation (H3Ac) and the linker histone H1. (A) H3Ac levels were determined by western blotting of unsorted brain nuclei and FACS purified nuclei from both wildtype and Mecp2-null brain. The western blot shows H3Ac levels in the neuronal nuclei plus histones from the same samples resolved and stained by coomassie blue as a loading control (lower panel). The graph indicates densitometric analysis of H3Ac levels in the different nuclei populations, normalised for differences in loading. The horizontal line represents no change between wildtype and Mecp2-null. (B) The upper graph shows the H3Ac profile across the promoter region of the Bdnf locus in wildtype (blue) and Mecp2-null (red) brains. The lower graph indicates the H3Ac fold difference between wildtype and MeCP2-null brain (pink); the MeCP2 ChIP profile is also shown (black). The blue vertical lines below the graph indicate CpG sites, with the CGI shaded in light grey. The gene structure is indicated by dark grey rectangles below. This data represents the average of 3 independent experiments. (C) Boxplot showing all H3Ac ChIP results for wildtype and Mecp2-null brain (n=100). (D) Quantitative western blotting for histone H1 and NeuN (as a loading control) using FACS purified neuronal nuclei from wildtype and Mecp2-null mice. The graph indicates densitometric analysis of H1 levels in the different nuclei populations. Error bars indicate mean +/− SEM and the KS test was used to determine statistical significance. See also Fig S3.

