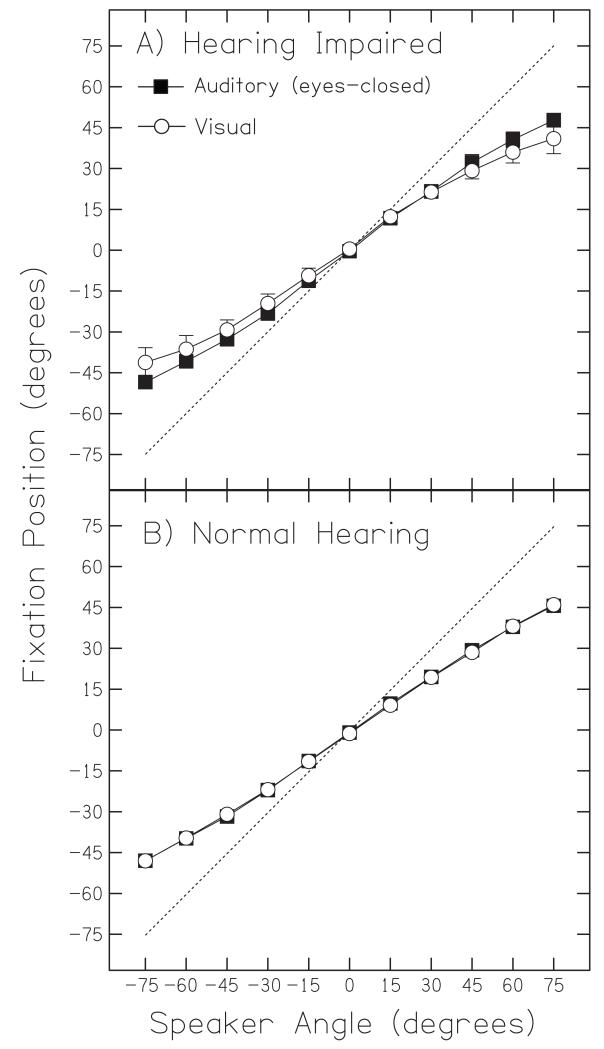
FIG. 3.
Group averages for auditory and visual fixation points. Mean fixation angle for all hearing-impaired (A) and normal-hearing (B) listeners in response to auditory (squares) and visual (circles) targets as a function of target loudspeaker angle. Error bars shown are standard error of the mean. The dotted line represents an ‘ideal’ orientation response, namely a fixation angle that precisely matched the target speaker angle.

