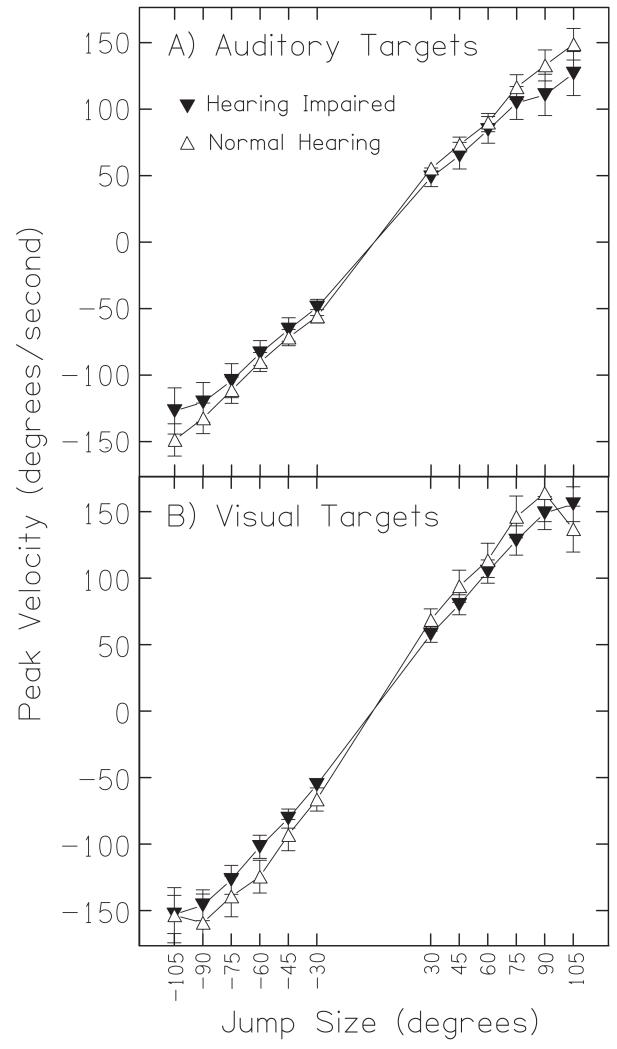
FIG. 5.
Peak velocity for auditory and visual targets. The mean peak velocity for all hearing-impaired (squares) and normal-hearing listeners (circles) in response to auditory (A) and visual targets (B) is plotted as a function of jump size. Error bars shown are standard error of the mean. The gap in the x-axis corresponds to the small jumps that were not included in the loudspeaker sequence.

