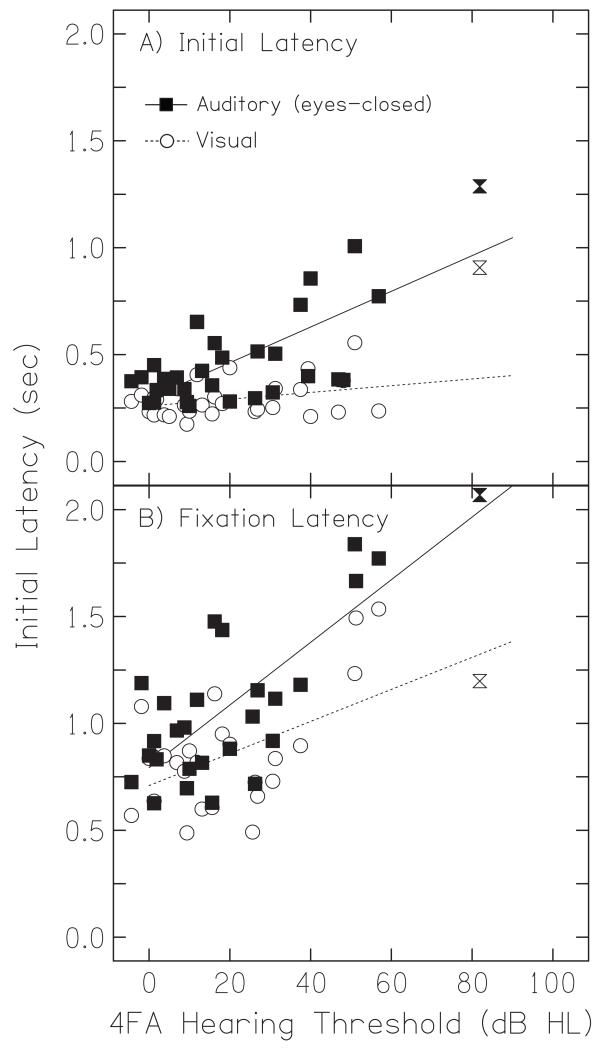
FIG. 6.
Response latencies for auditory and visual targets. Initial latency (A) and fixation latency (B) in response to auditory (squares) and visual targets (circles) is plotted as a function of hearing-loss. Linear regressions for auditory (solid line) and visual targets (dashed line) are plotted in both panels. Data points for the listener with the most severe loss are plotted as hourglass symbols but were not included in the regression.

