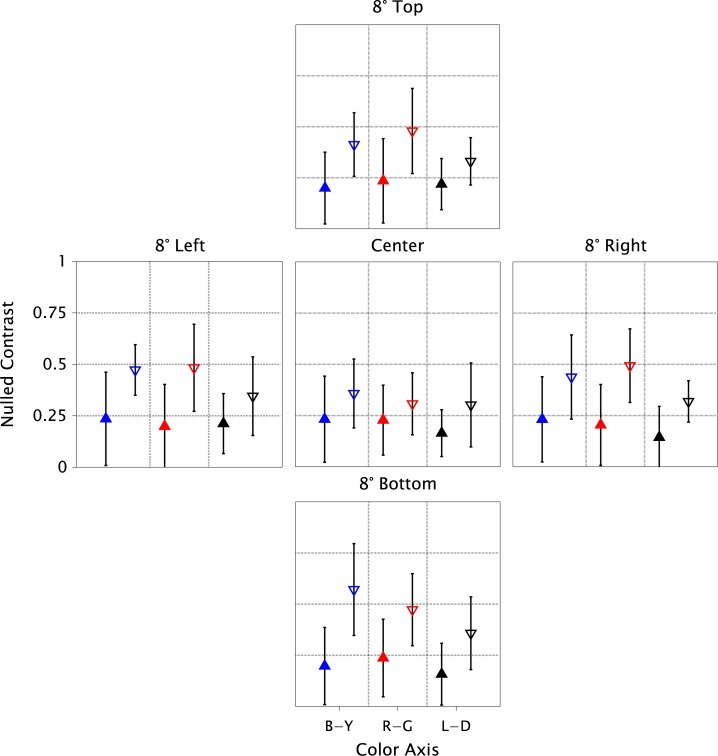
Figure 2.
Effect of glaucoma on retinal adaptation (groups): Mean Nulled-Contrast of patient group (filled triangles pointing up) and age-similar control group (empty triangles pointing down). Symbol colors: blue, red, and black represent Blue-Yellow, Red-Green, and Light-Dark, respectively. Panels are labeled by retinal locations. Error bars depict SEMs.

