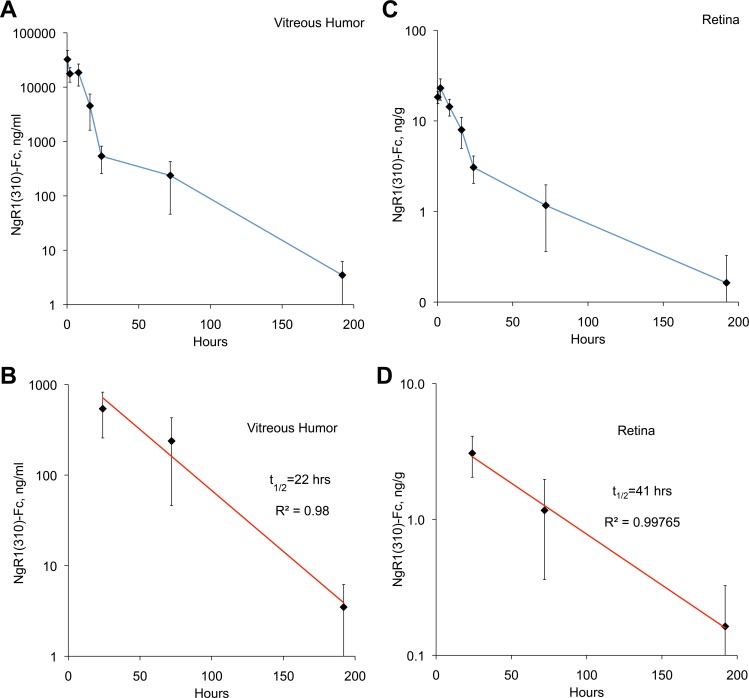
Figure 2.
Pharmacokinetics of intravitreal human NgR1(310)-Fc. Rats received a single dose of 5 μg hNgR1(310)-Fc injected in the vitreal humor in 1 μL of saline. Tissue was collected at the indicated times after injection and hNgR1(310)-Fc protein was measured. Data are mean ± SEM for n = 8 rats per time point. (A) The hNgR1(310)-Fc concentration in the vitreous is plotted as a function of time after injection. (B) Data from (A) for 1 to 7 days after injection are replotted on a log scale and fit to an exponential decay curve. (C) The hNgR1(310)-Fc concentration in the retinal tissue is plotted as a function of time after injection. (D) Data from (C) for 1 to 7 days postinjection are replotted on a log scale and fit to an exponential decay curve.

