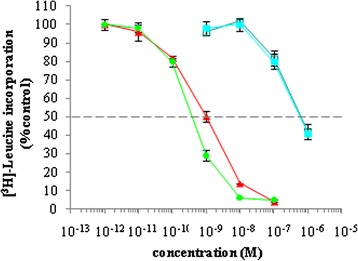
Figure 9.

Protein synthesis inhibition in Daudi cells exposed for 72 hours to increasing concentrations of 4KB-PE40 produced in E. coli (green circles), C4 (4KBopt218L-SAPHis6) (red triangles), rSAP (open blue squares), seed SAP (solid blue squares). Inhibition of protein synthesis is expressed as percentage of [3H]-leucine incorporation compared to untreated control cells. Error bars represent standard deviations from mean of triplicate samples.
