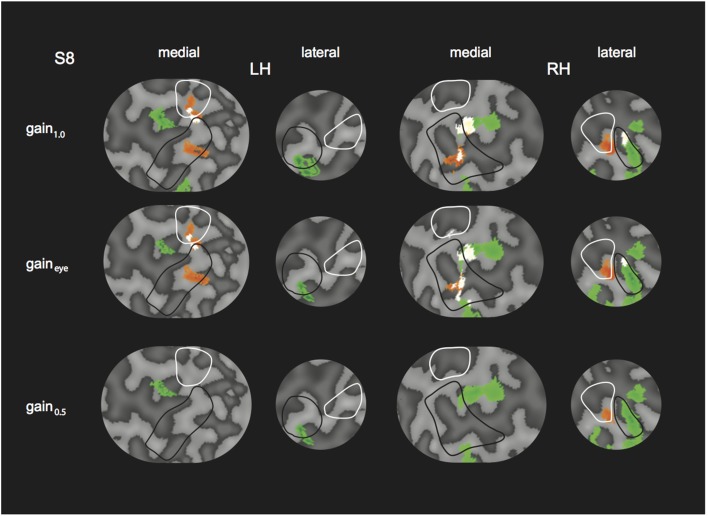
Figure 10.
Modulation by binocular signals for the 4P-model, with predictors adapted for different gain levels. Shown are sections of the flattened representation of both hemispheres in subject 8, encompassing medial and lateral motion areas. On top, peak activations are drawn for R (green—dark green), H (orange—red), and RH (white—yellow), for the gain1.0 model, the gaineye model, and the gain0.5 model. P(min) was set to the same level as in the original model (Figures 4, 5). The gaineye model was adjusted using measured gain values in subject 8 (V2R2H0: 0.96; V2R4H2: 0.96; V2R0H2: 1.03; V4R0H4: 0.94; V4R2H6: 0.99; V4R6H2: 0.90).

